
Is It Too Late To Consider Buying Expeditors International Of Washington (EXPD) After 1-Year Surge?
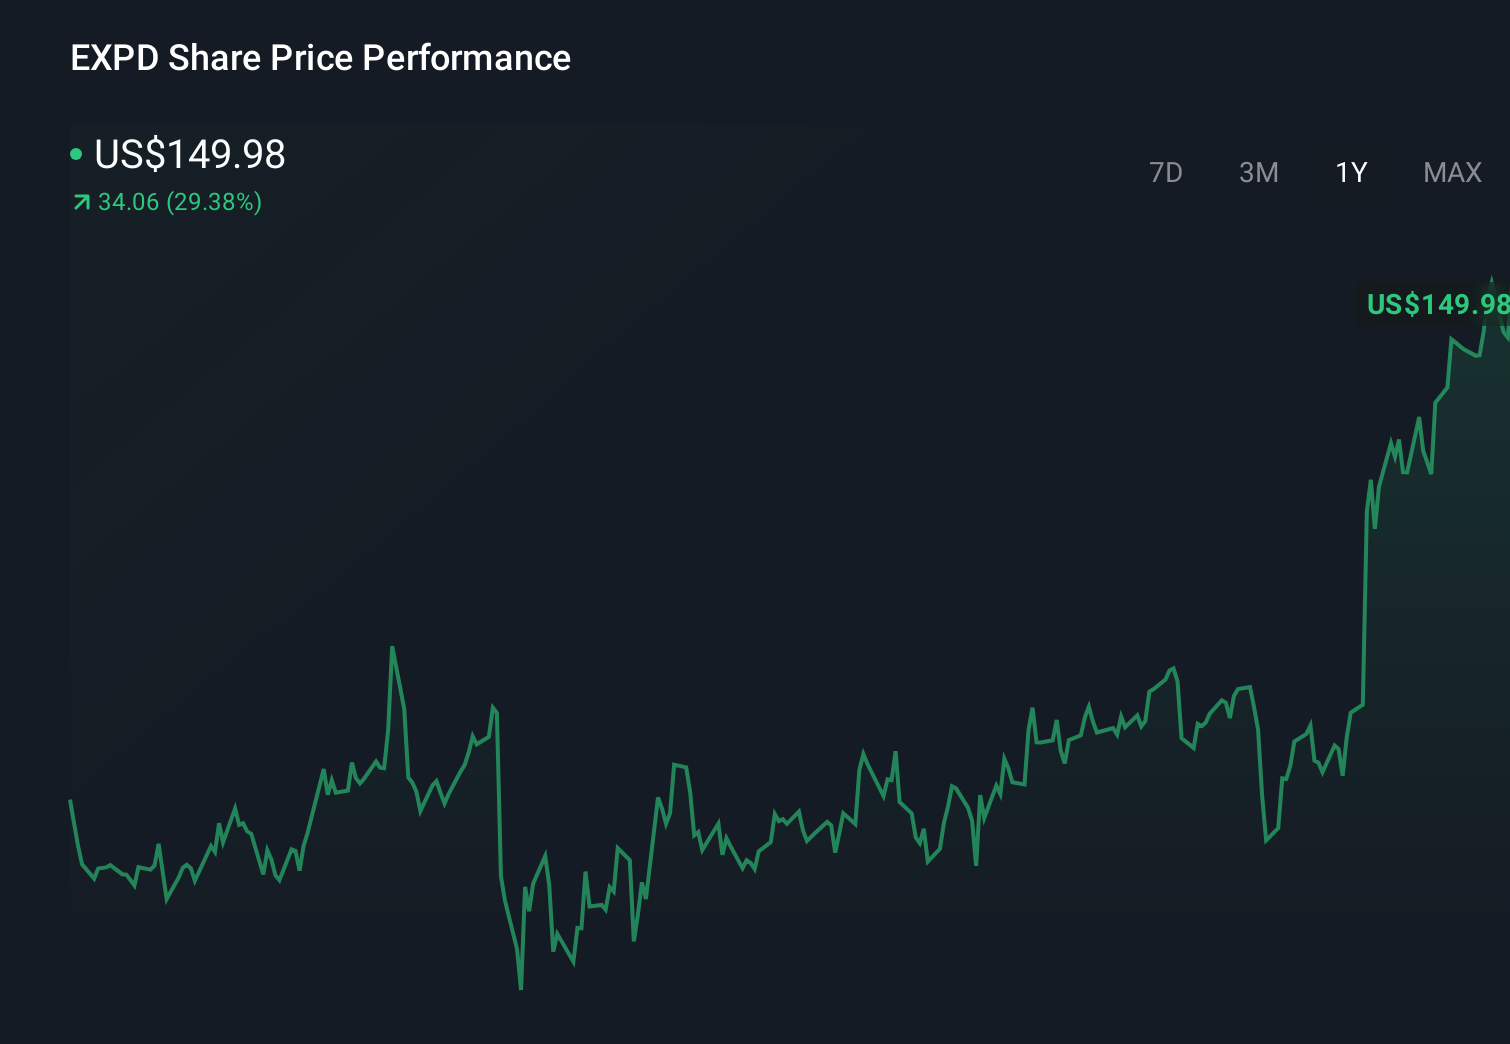
- If you are wondering whether Expeditors International of Washington at US$162.41 is offering good value right now, it helps to step back and look at what the current price might be implying.
- The stock has posted returns of 2.2% over the last 7 days, 8.5% over 30 days, 6.9% year to date, 49.0% over 1 year and 57.7% over 3 years, with a 5 year return of 83.4%. This naturally raises questions about how much of the story is already priced in.
- Recent attention on Expeditors has centered on its role in global freight forwarding and logistics, with investors weighing how trade flows and supply chain conditions influence sentiment toward the stock. This backdrop gives more context to the recent share price moves and why the company keeps coming up in conversations about transportation names.
- Right now, Expeditors scores 0 out of 6 on our valuation checks. Next, we will walk through what different valuation approaches say about the stock and then finish with a more holistic way to think about valuation that many investors overlook.
Expeditors International of Washington scores just 0/6 on our valuation checks. See what other red flags we found in the full valuation breakdown.
Approach 1: Expeditors International of Washington Discounted Cash Flow (DCF) Analysis
A Discounted Cash Flow model takes estimates of how much cash a business could generate in the future, then discounts those cash flows back into today’s dollars to arrive at an estimated intrinsic value per share.
For Expeditors International of Washington, the model used is a 2 Stage Free Cash Flow to Equity approach. The latest twelve month free cash flow is about $924 million. Analysts have provided explicit forecasts out to 2027, including projected free cash flow of $930.1 million in 2027. Beyond that, Simply Wall St extrapolates further, with the ten year projection reaching $1,115.8 million in 2035, all kept in present value terms by discounting those cash flows.
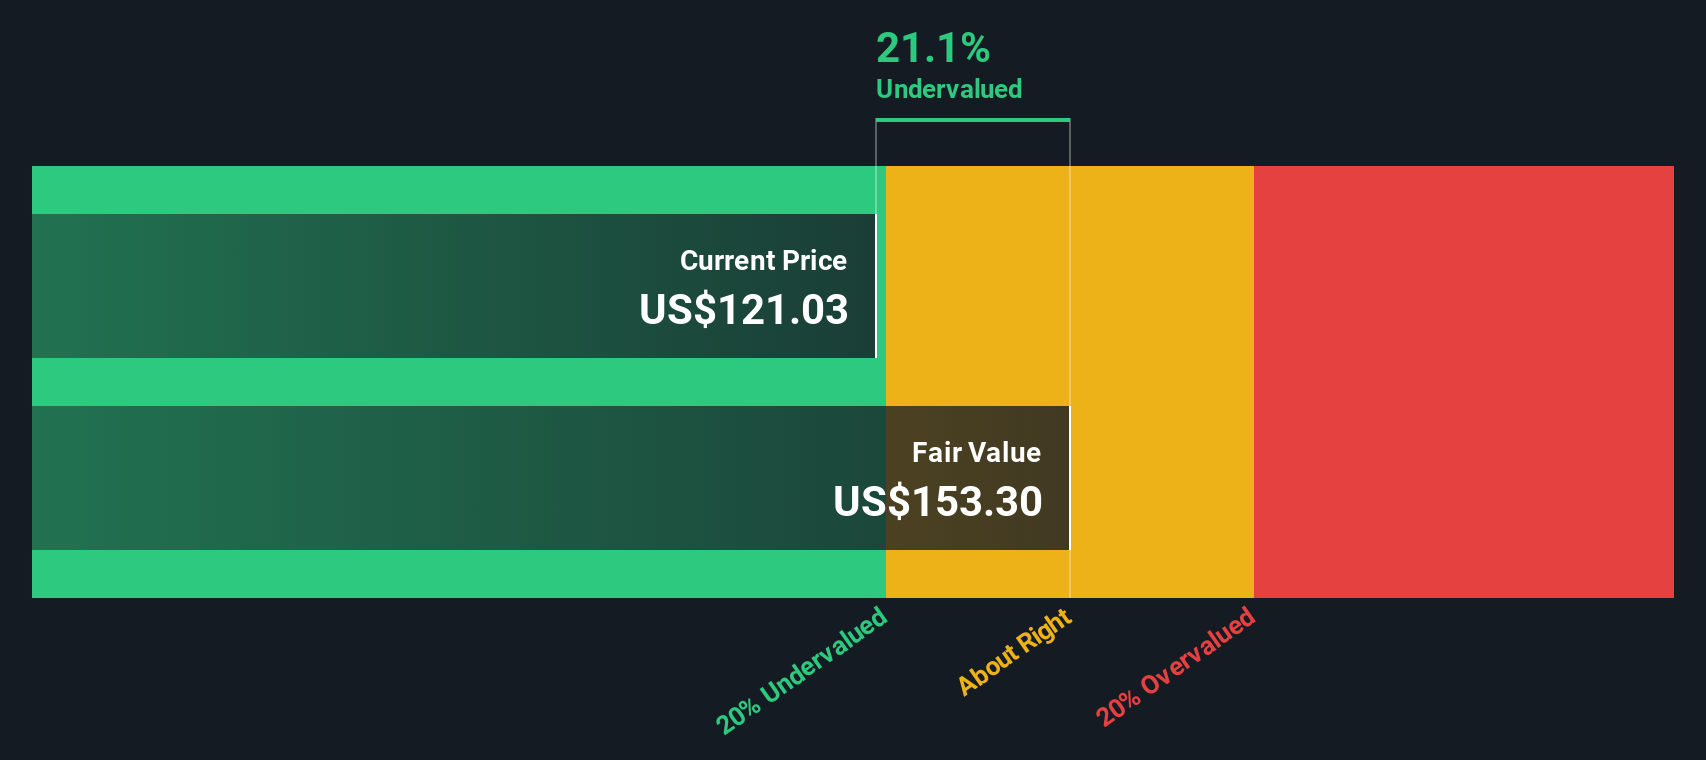
Putting those projections together, the DCF model arrives at an estimated intrinsic value of US$140.36 per share, compared with the current share price of US$162.41. That implies the shares are about 15.7% above this DCF estimate, so on this model Expeditors appears overvalued at the moment.
Result: OVERVALUED
Our Discounted Cash Flow (DCF) analysis suggests Expeditors International of Washington may be overvalued by 15.7%. Discover 863 undervalued stocks or create your own screener to find better value opportunities.
Approach 2: Expeditors International of Washington Price vs Earnings
For a profitable company like Expeditors International of Washington, the P/E ratio is a useful yardstick because it links what you pay directly to the earnings the business is generating today. Investors usually accept a higher or lower P/E depending on what they expect for future earnings growth and how much risk they see in those earnings.
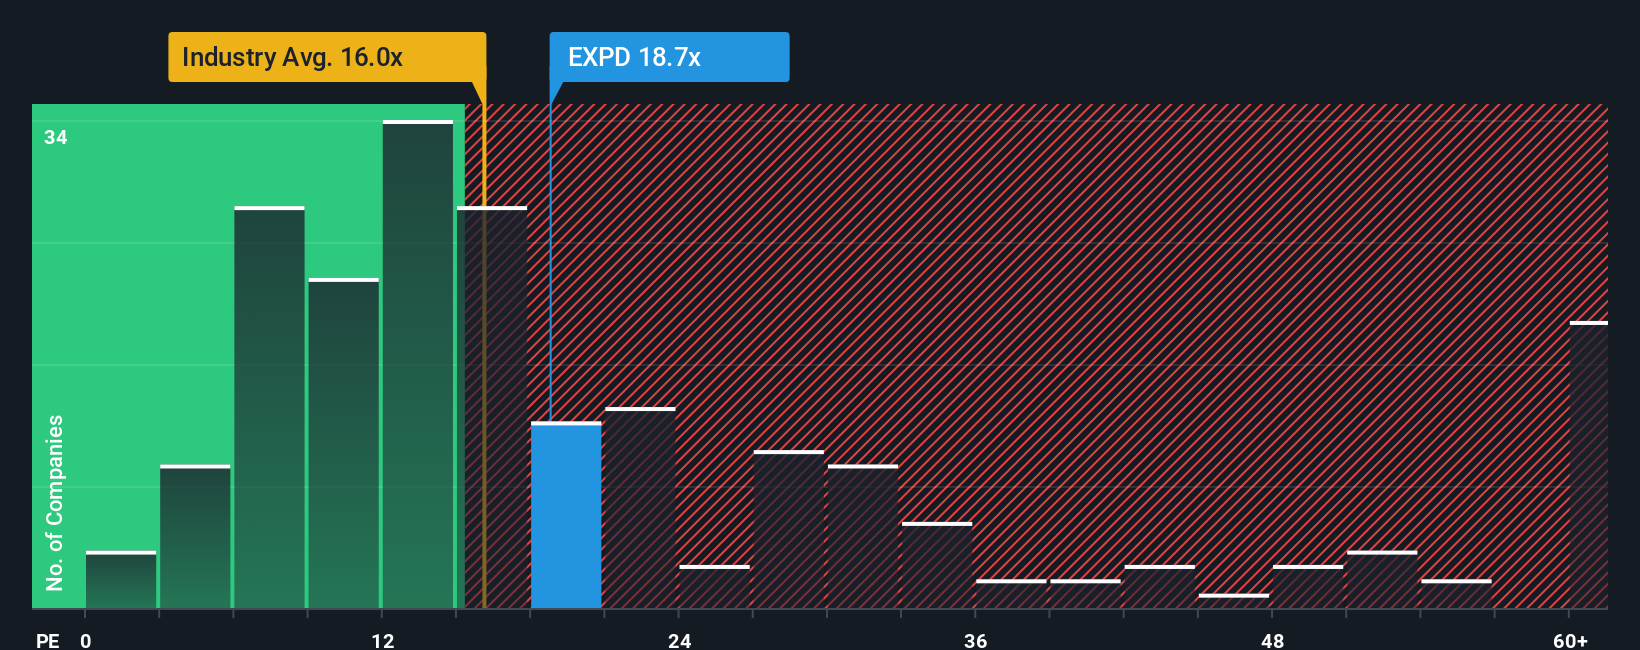
Expeditors currently trades on a P/E of 25.7x. That sits above the Logistics industry average P/E of about 16.2x and also above the peer group average of 20.4x, so the market is attaching a richer earnings multiple to this stock than to many of its sector peers.
Simply Wall St’s Fair Ratio for Expeditors is 14.5x. This is a proprietary P/E estimate that reflects factors such as the company’s earnings growth profile, industry, profit margins, market cap and risk characteristics. Because it is tailored to the company’s own fundamentals rather than broad group averages, it can offer a more targeted view than a simple comparison with peers or the wider industry.
With the current P/E of 25.7x sitting well above the Fair Ratio of 14.5x, the shares appear expensive on this earnings based yardstick.
Result: OVERVALUED
P/E ratios tell one story, but what if the real opportunity lies elsewhere? Discover 1445 companies where insiders are betting big on explosive growth.
Upgrade Your Decision Making: Choose your Expeditors International of Washington Narrative
Earlier we mentioned that there is an even better way to understand valuation, so let us introduce you to Narratives, which are simply your story about a company linked directly to the numbers you think are reasonable for its fair value, future revenue, earnings and margins.
A Narrative turns your view of Expeditors International of Washington into a clear forecast, then connects that forecast to an implied fair value per share, so you can compare it with the current price and decide whether the stock looks attractive or not for you.
On Simply Wall St, millions of investors share these Narratives on the Community page, where each one is easy to follow and is automatically updated when new information such as news or earnings is added to the model.
For example, one Expeditors Narrative might see a conservative outlook and arrive at a lower fair value, while another, more optimistic Narrative could assume stronger conditions and land on a much higher fair value, giving you a clear sense of how different perspectives translate into different prices.
Do you think there's more to the story for Expeditors International of Washington? Head over to our Community to see what others are saying!
This article by Simply Wall St is general in nature. We provide commentary based on historical data and analyst forecasts only using an unbiased methodology and our articles are not intended to be financial advice. It does not constitute a recommendation to buy or sell any stock, and does not take account of your objectives, or your financial situation. We aim to bring you long-term focused analysis driven by fundamental data. Note that our analysis may not factor in the latest price-sensitive company announcements or qualitative material. Simply Wall St has no position in any stocks mentioned.
Have feedback on this article? Concerned about the content? Get in touch with us directly. Alternatively, email editorial-team@simplywallst.com
Contact Us
Contact Number : +852 3852 8500Webull Securities Limited is licensed with the Securities and Futures Commission of Hong Kong (CE No. BNG700) for carrying out Type 1 License for Dealing in Securities, Type 2 License for Dealing in Futures Contracts and Type 4 License for Advising on Securities.

English