
Is It Too Late To Reconsider IPG Photonics (IPGP) After The Recent Share Price Rebound?
- Wondering whether IPG Photonics stock still offers value after a rough few years and a recent rebound, or if the price already reflects what you are paying for? This article walks through the key clues in the current valuation.
- The share price recently closed at US$81.75, with returns of 7.4% over 7 days, 9.3% over 30 days, 9.2% year to date, but a 24.0% decline over 3 years and a 67.4% decline over 5 years.
- These mixed returns sit alongside ongoing discussion around IPG Photonics' position in high power fiber lasers and its role in industrial applications, which can influence how investors think about the stock's risk and reward. Broader market sentiment toward specialized tech hardware has also been shifting over time, adding further context to recent moves in the share price.
- Simply Wall St currently gives IPG Photonics a 0 out of 6 valuation score, as it is assessed as undervalued in 0 of 6 checks. Next, we will look at traditional valuation approaches and then finish with a more holistic way to think about what the market might be pricing in.
IPG Photonics scores just 0/6 on our valuation checks. See what other red flags we found in the full valuation breakdown.
Approach 1: IPG Photonics Discounted Cash Flow (DCF) Analysis
A Discounted Cash Flow, or DCF, model takes projections of a company’s future cash flows and discounts them back to today using a required rate of return, to estimate what those future dollars might be worth in current terms.
For IPG Photonics, the model used is a 2 Stage Free Cash Flow to Equity approach, based on cash flows in US$. The latest twelve month free cash flow is around $34.74 million. Analysts provide explicit free cash flow estimates for the next few years, and Simply Wall St then extrapolates further out, up to ten years, using its own assumptions.
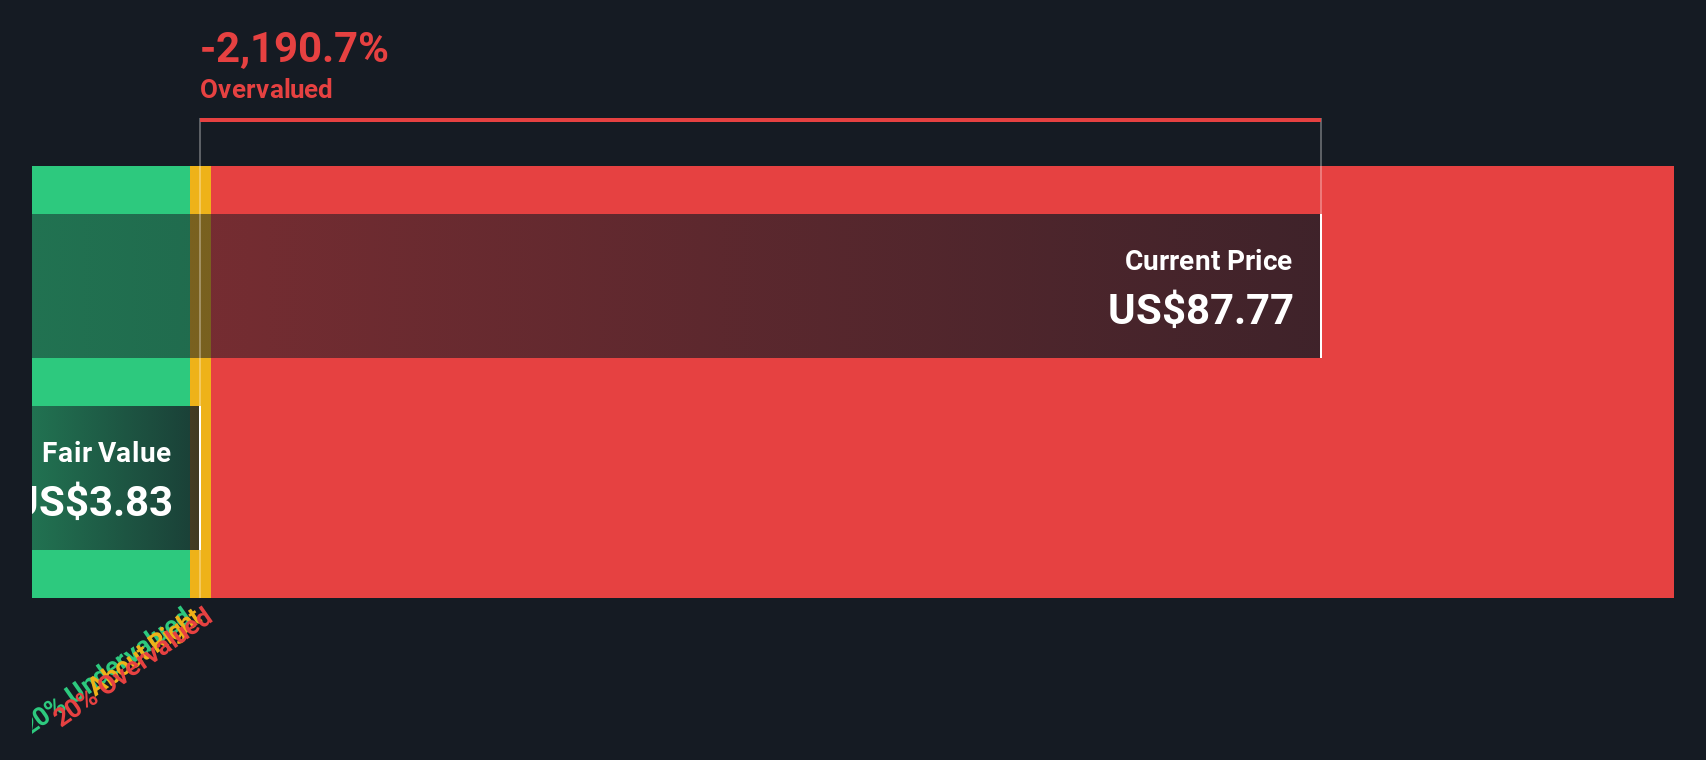
Under this model, free cash flow is projected to reach $191.74 million in 2035, with interim years stepping up from $46.75 million in 2026 and $78.00 million in 2027. After discounting all these projected cash flows back to today, the DCF suggests an intrinsic value of about $59.77 per share, compared to the recent share price of $81.75. That points to the shares being around 36.8% overvalued on this measure.
Result: OVERVALUED
Our Discounted Cash Flow (DCF) analysis suggests IPG Photonics may be overvalued by 36.8%. Discover 863 undervalued stocks or create your own screener to find better value opportunities.
Approach 2: IPG Photonics Price vs Earnings
For a profitable business like IPG Photonics, the P/E ratio is a common way to think about what you are paying for each dollar of current earnings. Investors usually accept a higher P/E when they expect stronger growth or see lower risk, and look for a lower P/E when growth expectations are more muted or risks feel higher.
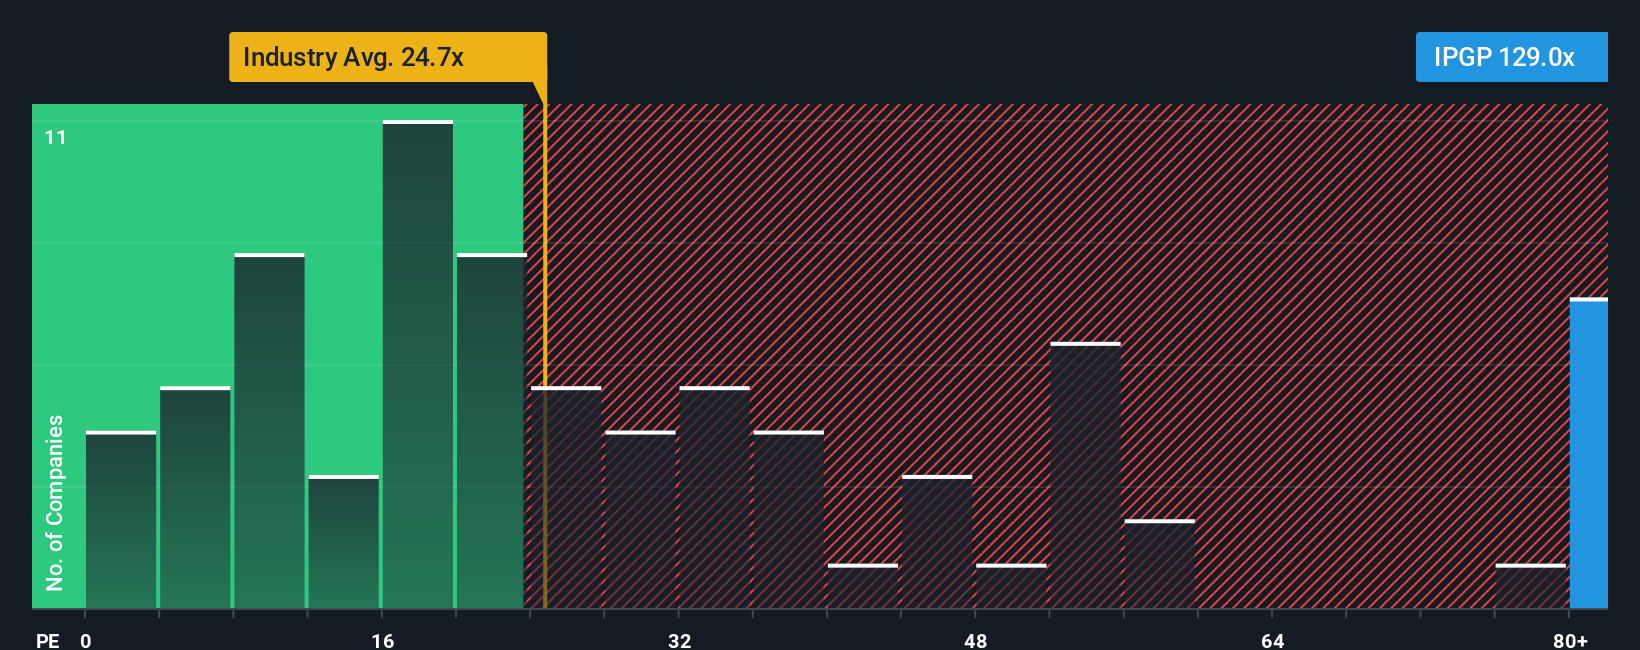
IPG Photonics currently trades on a P/E of 134.30x. That sits well above the Electronic industry average P/E of 27.84x and also above the peer average of 44.43x that Simply Wall St uses for comparison. On the face of it, the market is placing a much higher price tag on IPG Photonics earnings than on many industry peers.
Simply Wall St also calculates a proprietary “Fair Ratio” of 37.61x for IPG Photonics. This is designed to be a more tailored benchmark than a simple peer or industry comparison, because it incorporates factors such as earnings growth, profit margins, company size, industry, and risk profile. When you compare that Fair Ratio of 37.61x with the current P/E of 134.30x, the shares look expensive on this metric.
Result: OVERVALUED
P/E ratios tell one story, but what if the real opportunity lies elsewhere? Discover 1445 companies where insiders are betting big on explosive growth.
Upgrade Your Decision Making: Choose your IPG Photonics Narrative
Earlier we mentioned that there is an even better way to understand valuation, so let us introduce you to Narratives. These are simply your story about IPG Photonics tied to a set of numbers like future revenue, earnings, margins and a fair value. All of this is captured in an easy tool on Simply Wall St's Community page that helps you compare your fair value to the current price, see how other investors might lean toward a higher fair value of US$105 or a lower one of US$65, and watch those views update automatically when new news, earnings or guidance come through so you can decide how and when you might want to act.
Do you think there's more to the story for IPG Photonics? Head over to our Community to see what others are saying!

This article by Simply Wall St is general in nature. We provide commentary based on historical data and analyst forecasts only using an unbiased methodology and our articles are not intended to be financial advice. It does not constitute a recommendation to buy or sell any stock, and does not take account of your objectives, or your financial situation. We aim to bring you long-term focused analysis driven by fundamental data. Note that our analysis may not factor in the latest price-sensitive company announcements or qualitative material. Simply Wall St has no position in any stocks mentioned.
Have feedback on this article? Concerned about the content? Get in touch with us directly. Alternatively, email editorial-team@simplywallst.com
Contact Us
Contact Number : +852 3852 8500Webull Securities Limited is licensed with the Securities and Futures Commission of Hong Kong (CE No. BNG700) for carrying out Type 1 License for Dealing in Securities, Type 2 License for Dealing in Futures Contracts and Type 4 License for Advising on Securities.

English