
Is NetApp (NTAP) Starting To Look Attractive After The Recent Share Price Pullback?
- If you are wondering whether NetApp at around US$97 per share still offers value, you are not alone. This article walks through what the current price might mean for long term investors.
- The stock has seen a 9.8% decline over the last 7 days and a 12.5% decline over the last 30 days, on top of an 8.8% decline year to date and a 21.4% decline over the last year, even though the 3 year and 5 year returns sit at 56.1% and 58.6% respectively.
- These moves have come alongside ongoing interest in established data storage and cloud infrastructure providers and continuing debate over how mature tech names fit into portfolios focused on long term cash generation. For NetApp specifically, investors have been weighing its role in a sector that often sees sentiment swing between enthusiasm for growth and caution about valuation, which can feed directly into price moves like those you are seeing.
- Against that backdrop, NetApp currently has a valuation score of 6/6. Next we will walk through the key valuation approaches behind that score, before finishing with a way to think about value that goes beyond the usual multiples and models.
Find out why NetApp's -21.4% return over the last year is lagging behind its peers.
Approach 1: NetApp Discounted Cash Flow (DCF) Analysis
The Discounted Cash Flow, or DCF, model estimates what a business could be worth by projecting its future cash flows and discounting them back to today, so you can compare that value to the current share price.
For NetApp, the model used is a 2 Stage Free Cash Flow to Equity approach. The company's latest twelve month free cash flow sits at about $1.68b. Analyst and extrapolated estimates suggest free cash flow of $1.52b in 2026, rising to $1.94b by 2028, with further projections reaching $2.65b by 2035. Simply Wall St uses analyst inputs where available, then extends those forecasts over the following years to build a ten year cash flow path.
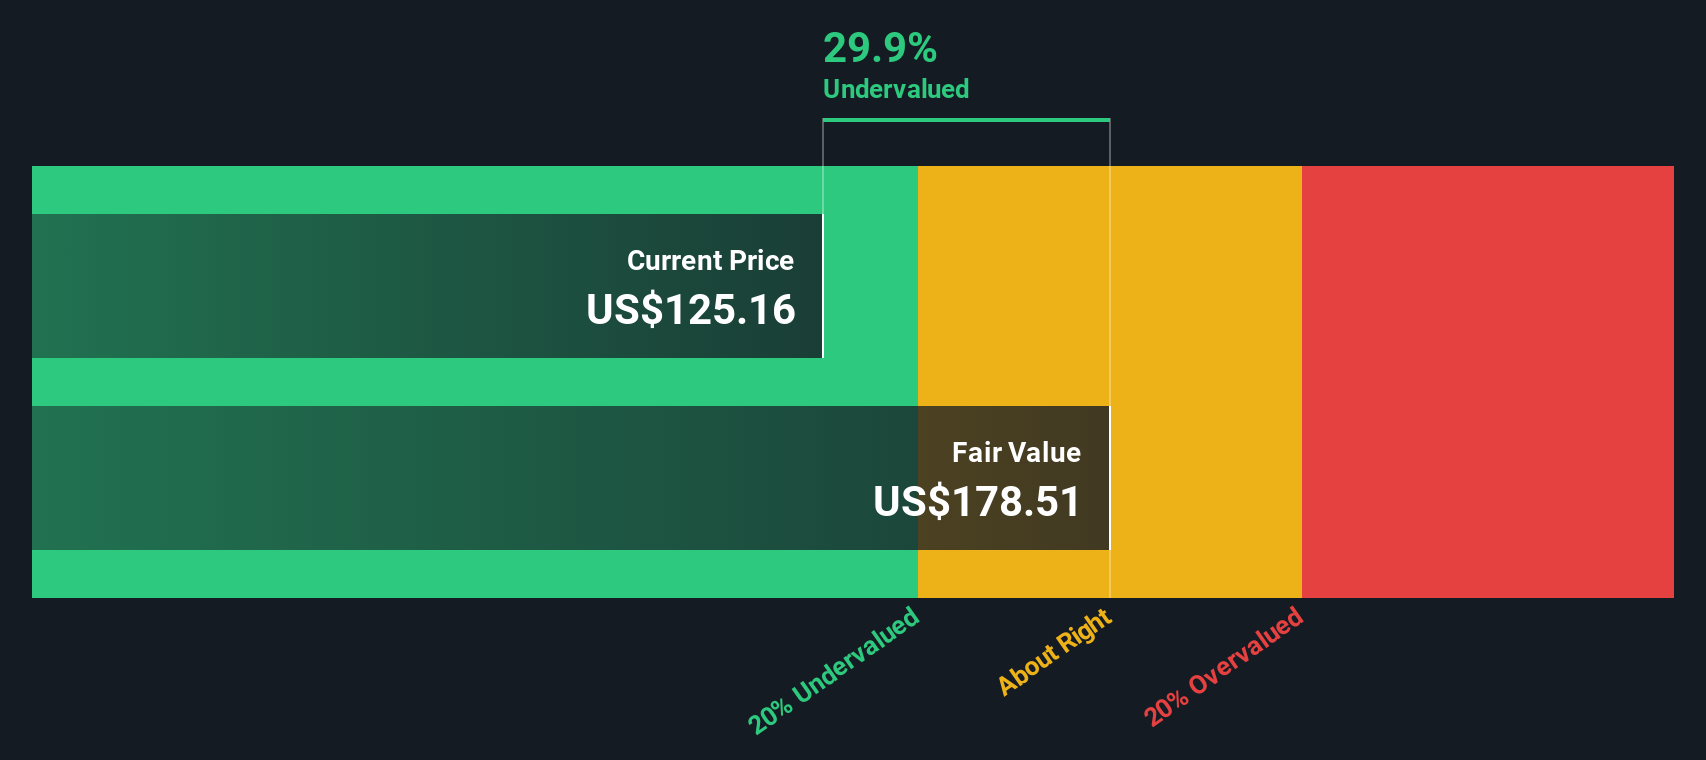
After discounting all those projected cash flows back to today, the DCF model arrives at an estimated intrinsic value of about $184.18 per share. Against a current market price around $97, this implies the shares trade at roughly a 47.3% discount to that intrinsic value, which suggests that on this model NetApp stock may be trading below the estimated intrinsic value.
Result: UNDERVALUED
Our Discounted Cash Flow (DCF) analysis suggests NetApp is undervalued by 47.3%. Track this in your watchlist or portfolio, or discover 881 more undervalued stocks based on cash flows.
Approach 2: NetApp Price vs Earnings (P/E)
For a profitable company like NetApp, the P/E ratio is a straightforward way to relate what you pay for the stock to the earnings it currently generates. It helps you see how many dollars investors are paying for each dollar of earnings.
What counts as a normal or fair P/E usually reflects how the market views a company’s growth prospects and risk. Higher expected growth or lower perceived risk can justify a higher P/E, while slower growth or higher uncertainty can point to a lower one.
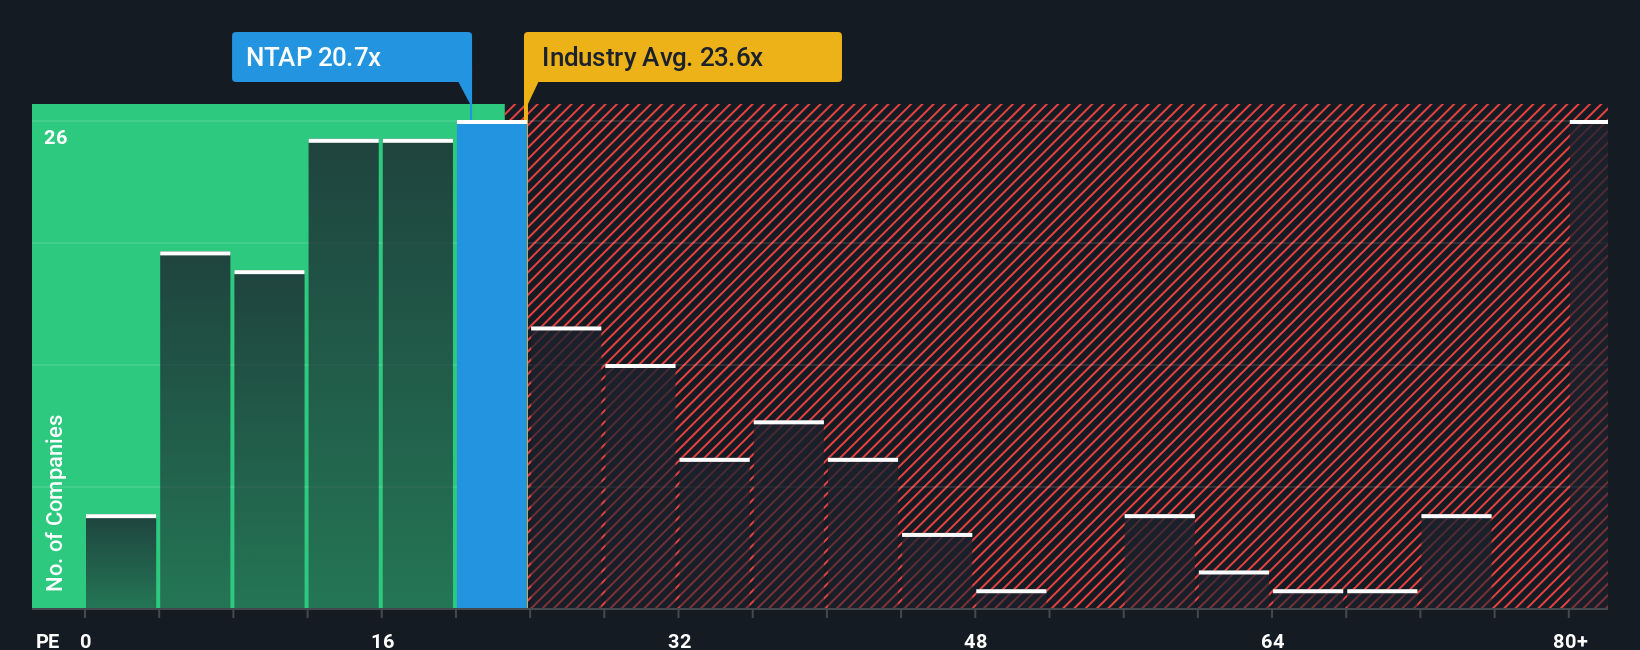
NetApp currently trades on a P/E of 16.34x. That sits below the Tech industry average of 22.66x and well below the peer group average of 64.21x, so on simple comparisons the valuation looks restrained. Simply Wall St also calculates a Fair Ratio of 25.11x, which is the P/E that might be expected given factors such as NetApp’s earnings profile, margins, industry, market cap and specific risks.
This Fair Ratio is more tailored than a basic industry or peer comparison because it accounts for company specific characteristics rather than grouping everything under a single sector average. Comparing NetApp’s current 16.34x P/E to the 25.11x Fair Ratio suggests the shares trade below that Fair Ratio.
Result: UNDERVALUED
P/E ratios tell one story, but what if the real opportunity lies elsewhere? Discover 1447 companies where insiders are betting big on explosive growth.
Upgrade Your Decision Making: Choose your NetApp Narrative
Earlier we mentioned that there is an even better way to understand valuation, so let us introduce you to Narratives, which are simply your own story about a company linked directly to the numbers you think are realistic for its future revenue, earnings and margins.
On Simply Wall St, Narratives live on the Community page and let you turn that story into a clear financial forecast and a Fair Value estimate that you can compare to today’s share price. This helps you decide whether a stock looks attractive, fairly priced or expensive based on your view.
Because Narratives on the platform are refreshed when new information like company news or earnings is added, your Fair Value updates automatically instead of sitting as a static spreadsheet you have to rework every time something changes.
With NetApp, for example, one investor might build a Narrative that assumes more conservative cash flow and margins, while another might plug in stronger assumptions for the same metrics. Those different views would show up as different Fair Values that can be set against the current price to guide their decisions.
Do you think there's more to the story for NetApp? Head over to our Community to see what others are saying!

This article by Simply Wall St is general in nature. We provide commentary based on historical data and analyst forecasts only using an unbiased methodology and our articles are not intended to be financial advice. It does not constitute a recommendation to buy or sell any stock, and does not take account of your objectives, or your financial situation. We aim to bring you long-term focused analysis driven by fundamental data. Note that our analysis may not factor in the latest price-sensitive company announcements or qualitative material. Simply Wall St has no position in any stocks mentioned.
Have feedback on this article? Concerned about the content? Get in touch with us directly. Alternatively, email editorial-team@simplywallst.com
Contact Us
Contact Number : +852 3852 8500Webull Securities Limited is licensed with the Securities and Futures Commission of Hong Kong (CE No. BNG700) for carrying out Type 1 License for Dealing in Securities, Type 2 License for Dealing in Futures Contracts and Type 4 License for Advising on Securities.

English