
Is It Time To Reassess Sea (SE) After Its Mixed Share Price Performance?
- If you are wondering whether Sea's current share price still reflects a reasonable entry point or not, it helps to break the story down into what the recent returns and valuation numbers are actually telling you.
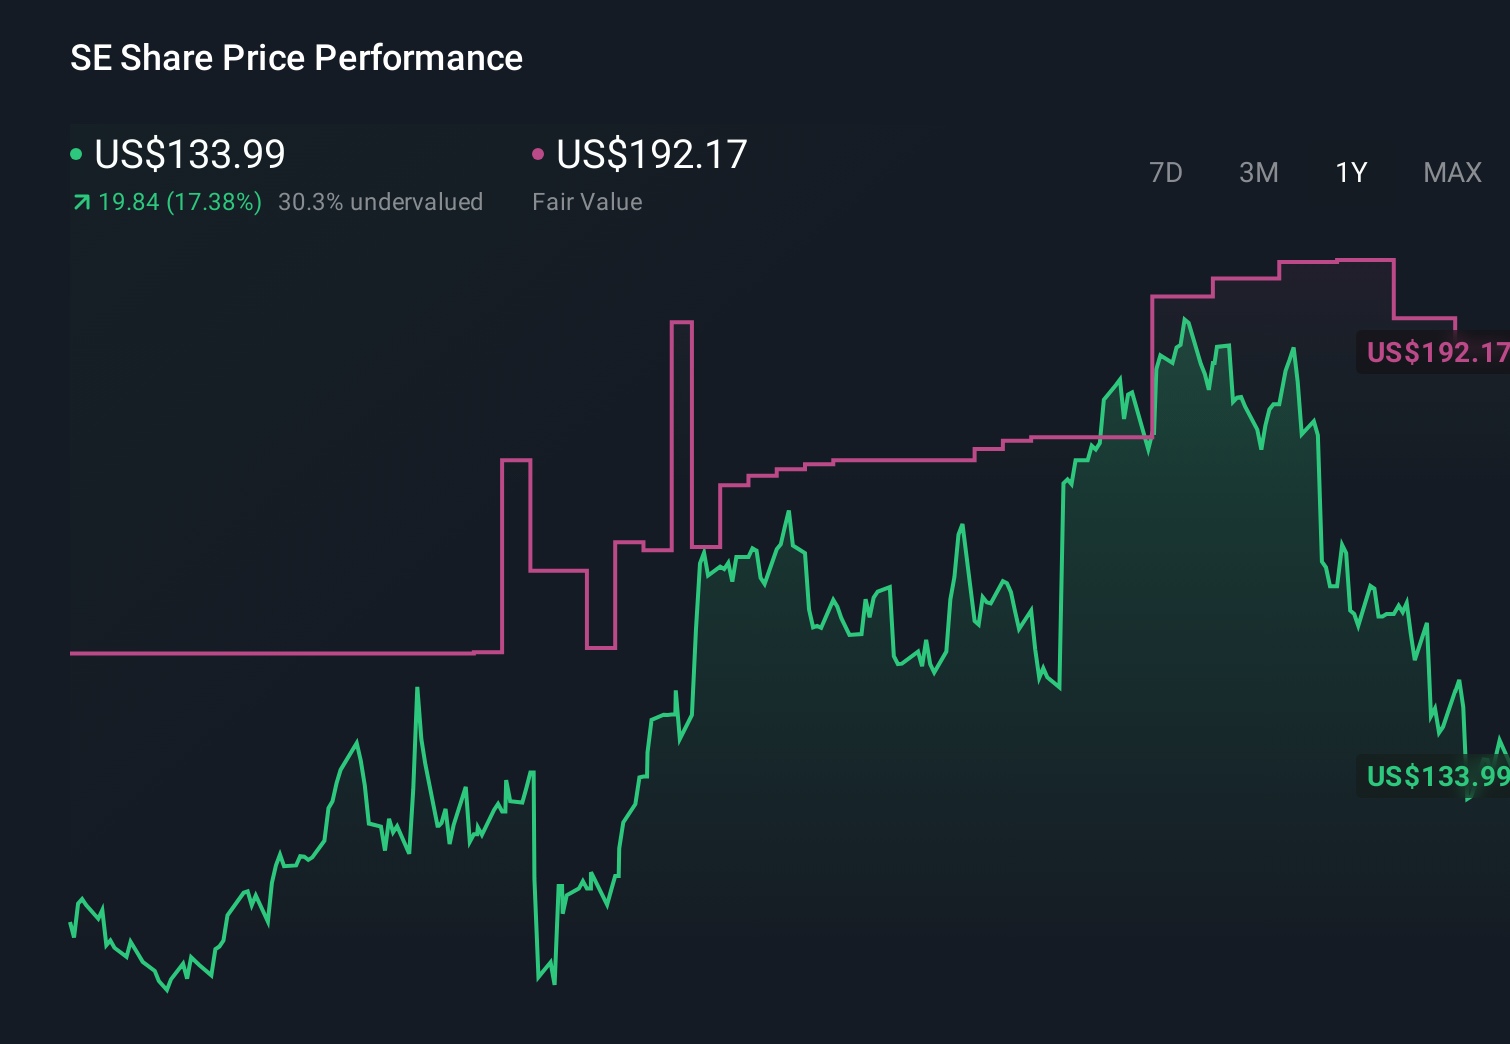
- The stock last closed at US$122.83, with returns of a 0.9% decline over 7 days, a 2.3% decline over 30 days, a 6.6% decline year to date, a 5.5% gain over 1 year and an 83.3% gain over 3 years, set against a 44.1% decline over 5 years.
- These mixed returns leave many investors trying to work out whether recent price levels reflect changing expectations for Sea's long term prospects or just shifting risk appetite in the market. With that in mind, it becomes even more important to ground the conversation in clear valuation checks rather than headlines alone.
- On Simply Wall St's 6 point valuation framework, Sea currently scores 3 out of 6, which suggests some checks flag the stock as potentially undervalued while others do not. We will walk through those methods next before finishing with a broader way to think about what valuation really means for you.
Find out why Sea's 5.5% return over the last year is lagging behind its peers.
Approach 1: Sea Discounted Cash Flow (DCF) Analysis
A Discounted Cash Flow model takes estimates of the cash a company could generate in the future, then discounts those back to today to arrive at an estimated value per share.
For Sea, Simply Wall St uses a 2 Stage Free Cash Flow to Equity model built on cash flow projections. The latest twelve month free cash flow is about $3.58b. Analyst estimates and extrapolations point to free cash flow of $4.07b in 2026 and $8.42b in 2030, with later years gradually rising as well. These projections, expressed in $ and discounted back to today, are used to work out what the whole business might be worth now.
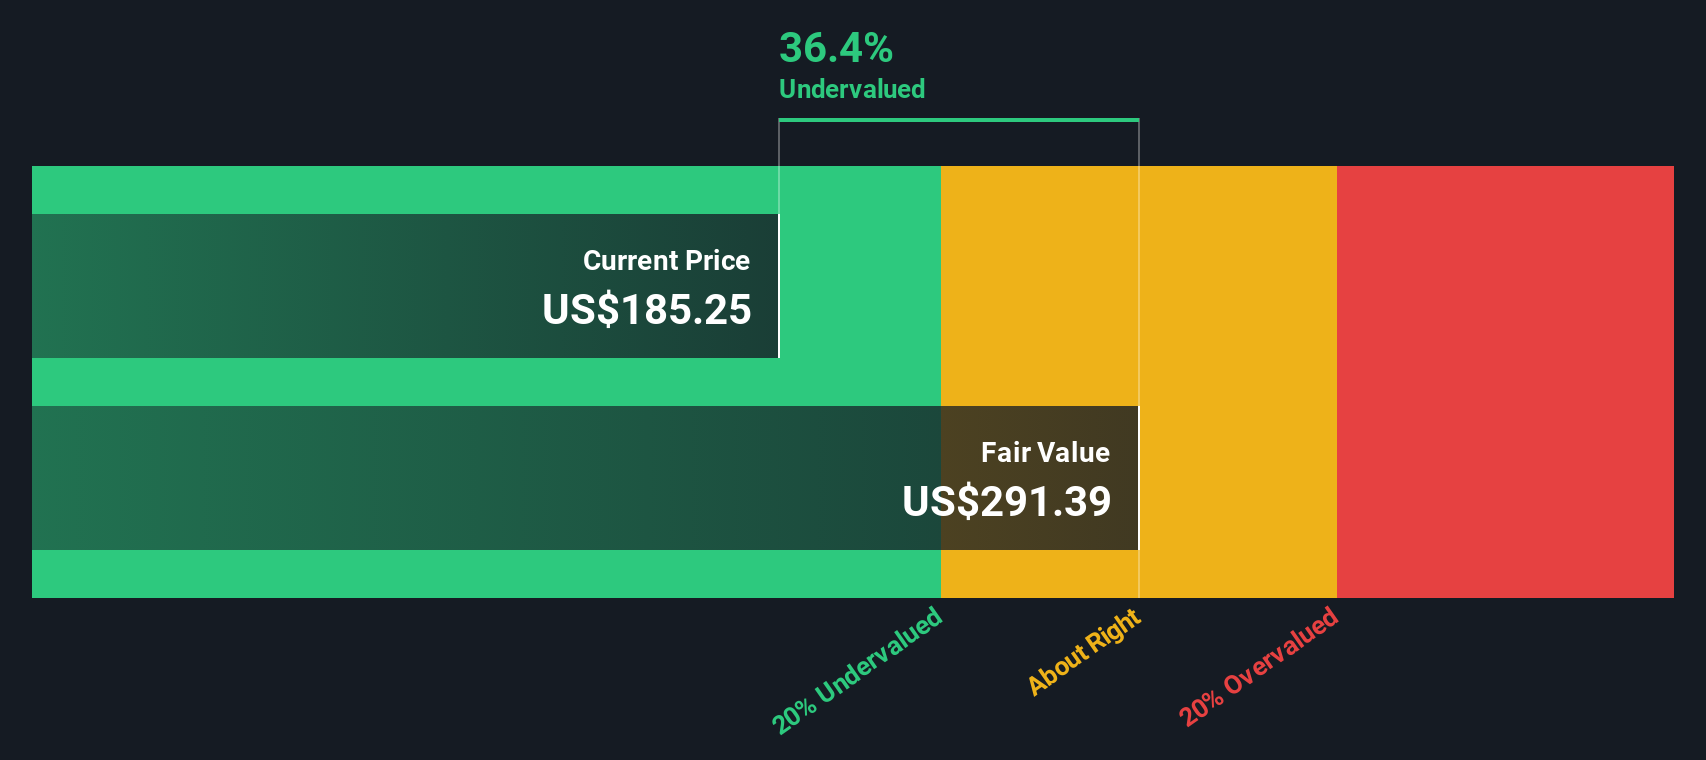
On this basis, the DCF model suggests an intrinsic value of about $276.47 per share. Compared with the recent share price of $122.83, the model implies the stock trades at roughly a 55.6% discount, which indicates potential undervaluation according to this framework.
Result: UNDERVALUED
Our Discounted Cash Flow (DCF) analysis suggests Sea is undervalued by 55.6%. Track this in your watchlist or portfolio, or discover 880 more undervalued stocks based on cash flows.
Approach 2: Sea Price vs Earnings
For profitable companies, the P/E ratio is a useful shorthand because it links what you pay per share directly to the earnings that each share generates. It gives you a quick sense of how many dollars investors are currently willing to pay for one dollar of earnings.
What counts as a "normal" P/E depends on how the market views a company’s growth potential and risk. Higher expected growth or lower perceived risk can justify a higher multiple, while slower growth or higher risk usually calls for a lower one.
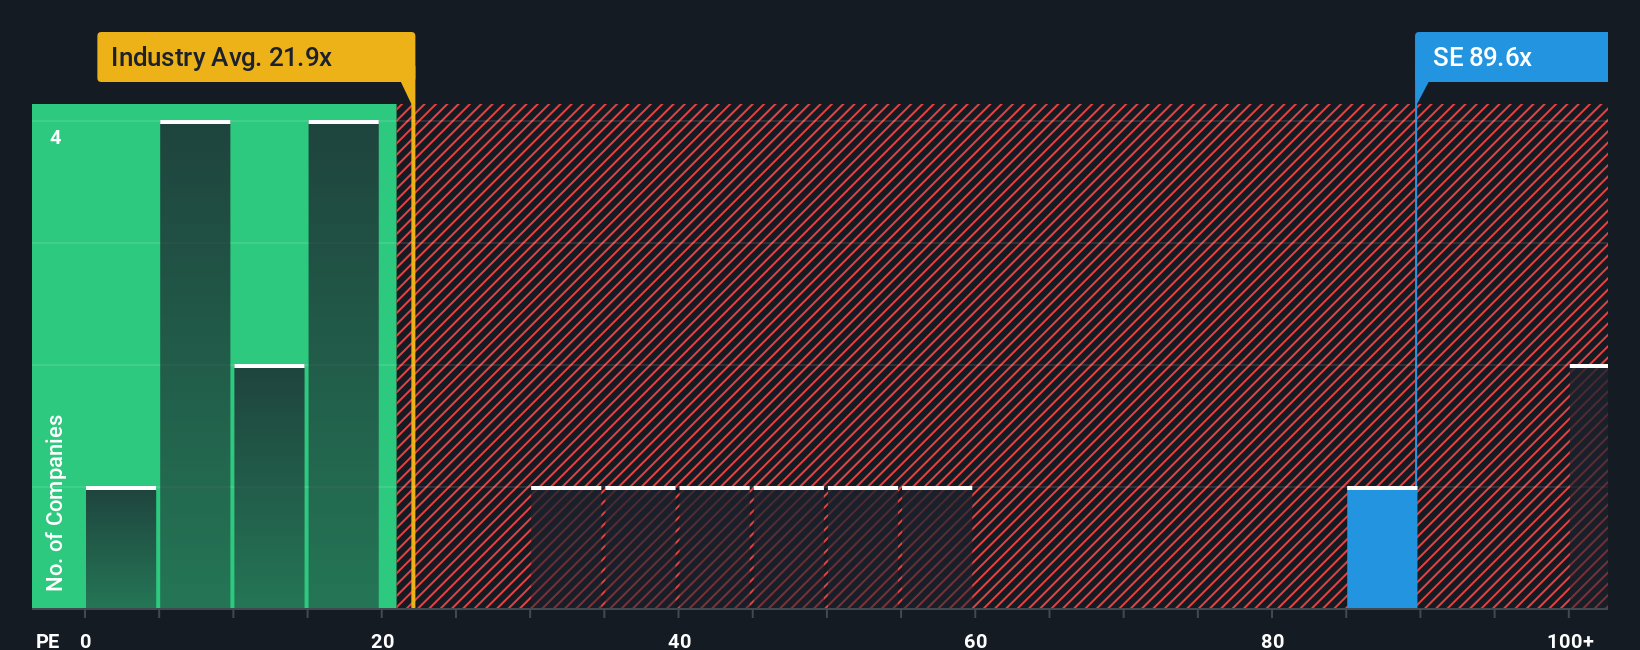
Sea currently trades on a P/E of 51.27x. That is above both the multiline retail industry average of 20.00x and the peer group average of 43.74x. Simply Wall St’s Fair Ratio framework estimates a P/E of 34.47x for Sea, based on factors such as earnings growth profile, industry, profit margins, market cap and company specific risks. This Fair Ratio is designed to be more tailored than a simple peer or industry comparison because it blends these drivers into a single benchmark.
Set against this Fair Ratio, Sea’s current P/E of 51.27x screens as higher than what the model suggests as fair.
Result: OVERVALUED
P/E ratios tell one story, but what if the real opportunity lies elsewhere? Discover 1427 companies where insiders are betting big on explosive growth.
Upgrade Your Decision Making: Choose your Sea Narrative
Earlier we mentioned that there is an even better way to understand valuation. Let us introduce you to Narratives, which let you attach a simple story, your view of Sea’s future revenue, earnings and margins, to the numbers behind your own fair value estimate.
A Narrative connects three things in one place: the company’s story, a financial forecast and a fair value that falls out of those assumptions. This allows you to see clearly why you think Sea is worth a certain price.
On Simply Wall St, Narratives sit inside the Community page and are designed to be easy to use. You can quickly plug in your expectations, compare your Fair Value to the current price and decide whether Sea looks closer to a buy, a hold or a sell for you, while the Narrative keeps updating as new news or earnings data arrive.
For example, one Sea Narrative might assume stronger revenue and margin progress and arrive at a much higher fair value. Another might use more conservative inputs and land on a much lower figure, which shows how different investors can reasonably see the same stock in very different ways.
Do you think there's more to the story for Sea? Head over to our Community to see what others are saying!
This article by Simply Wall St is general in nature. We provide commentary based on historical data and analyst forecasts only using an unbiased methodology and our articles are not intended to be financial advice. It does not constitute a recommendation to buy or sell any stock, and does not take account of your objectives, or your financial situation. We aim to bring you long-term focused analysis driven by fundamental data. Note that our analysis may not factor in the latest price-sensitive company announcements or qualitative material. Simply Wall St has no position in any stocks mentioned.
Have feedback on this article? Concerned about the content? Get in touch with us directly. Alternatively, email editorial-team@simplywallst.com
Contact Us
Contact Number : +852 3852 8500Webull Securities Limited is licensed with the Securities and Futures Commission of Hong Kong (CE No. BNG700) for carrying out Type 1 License for Dealing in Securities, Type 2 License for Dealing in Futures Contracts and Type 4 License for Advising on Securities.

English