
A Look At Mongolian Mining (SEHK:975) Valuation After A Strong Year Of Share Price Gains
Recent share performance and business snapshot
Mongolian Mining (SEHK:975) has attracted fresh attention after a strong share price run over the past year, alongside mixed shorter term returns and a value score of 1 that some investors may find interesting.
The Hong Kong listed coking coal producer, which reported revenue of $845.371m and net income of $82.325m, now trades at HK$12.65. Performance over the past month and past 3 months is shaping how investors assess its current valuation.
See our latest analysis for Mongolian Mining.
At HK$12.65, Mongolian Mining’s recent 7 day share price return of 10.19% and 30 day share price return of 16.59% sit alongside a 1 year total shareholder return of 73.53% and a very large 5 year total shareholder return. This suggests momentum has been building over time as investors reassess both growth potential and risk around the coking coal business.
If this kind of move has you thinking about what else could be on your radar, it might be a good moment to broaden your search with fast growing stocks with high insider ownership.
With Mongolian Mining up 73.53% over the past year and trading on a low value score of 1, the big question is whether the shares still offer mispriced upside or if the market is already banking on future growth.
Price-to-Earnings of 20.4x: Is it justified?
Mongolian Mining trades on a P/E of 20.4x, and at a last close of HK$12.65 the shares look more expensive than the wider Hong Kong metals and mining group but cheaper than its selected peer set.
The P/E ratio tells you how much investors are currently paying for each unit of earnings, which is especially watched for miners with cyclical profit profiles. In this case, the company’s P/E of 20.4x sits above the Hong Kong metals and mining industry average of 18.1x, yet below the peer average of 26.6x, so the market is not placing it at either extreme.
One thing to keep in mind is that earnings have been under pressure recently, with earnings falling 62.2% over the past year and net profit margins at 9.7% compared to 20.6% a year earlier. Against that backdrop and with a Return on Equity of 6.6%, the current P/E points to investors being willing to look beyond the latest earnings dip, even though the stock underperformed the wider industry return of 171.3% over the past year.
Compared to the sector, the 20.4x P/E is higher than the Hong Kong metals and mining average of 18.1x, which signals investors are paying a premium relative to the broader industry, but lower than the 26.6x peer average, which keeps it below the higher end of comparable valuations.
See what the numbers say about this price — find out in our valuation breakdown.
Result: Price-to-Earnings of 20.4x (ABOUT RIGHT)
However, recent earnings pressure and a lower net profit margin, along with a P/E above the wider sector, could challenge the case for further multiple expansion.
Find out about the key risks to this Mongolian Mining narrative.
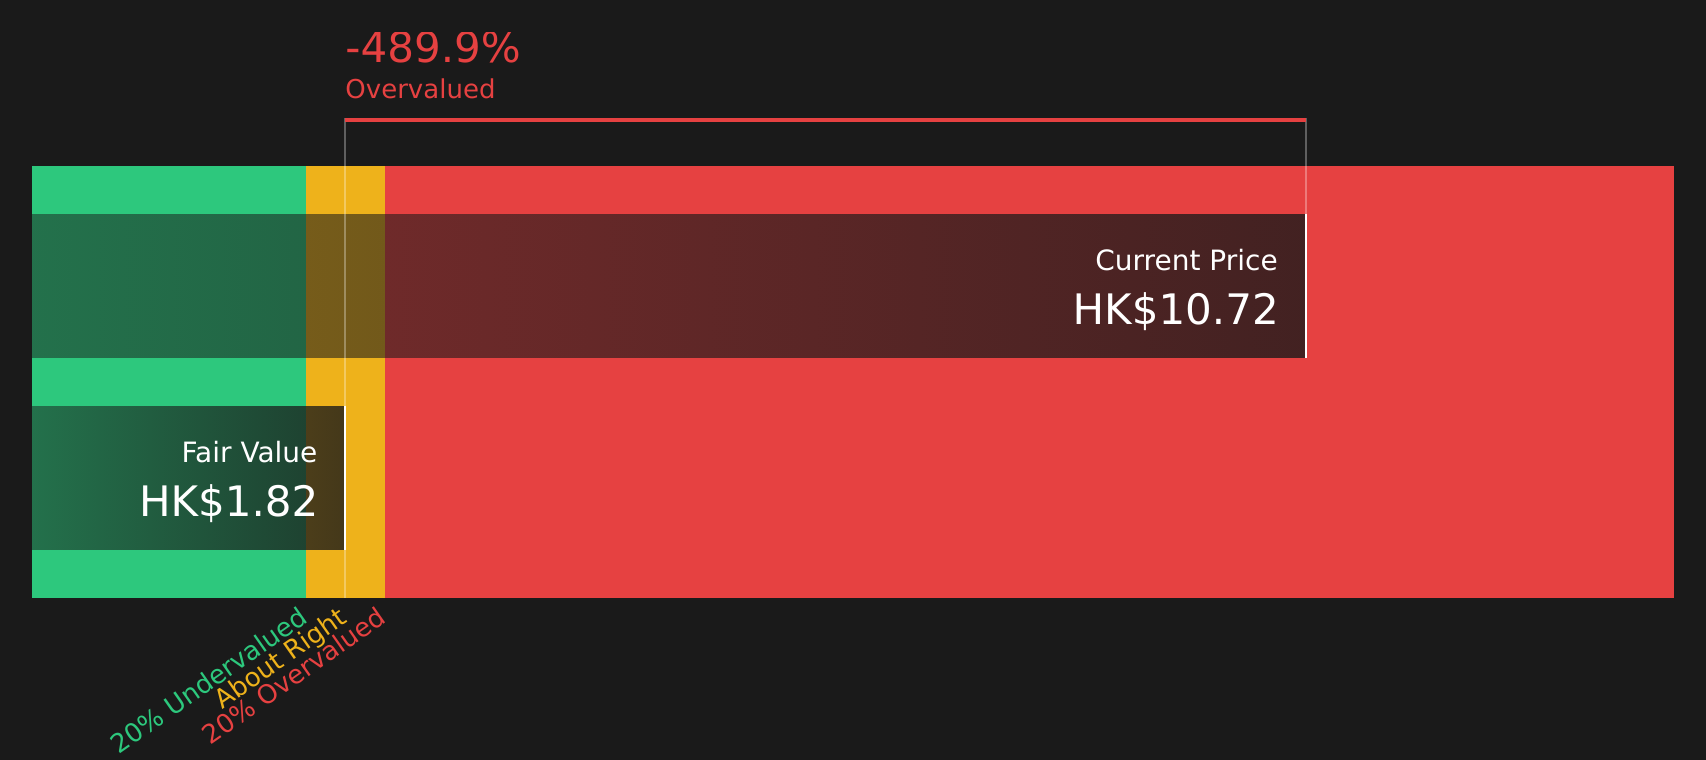
Another view using our DCF model
While the P/E of 20.4x puts Mongolian Mining slightly above the Hong Kong metals and mining average, our DCF model points in a different direction. At HK$12.65, the shares are trading well above an estimated future cash flow value of about HK$0.05. This flags valuation risk rather than a clear bargain. So how much weight do you put on cash flows versus earnings multiples?
Look into how the SWS DCF model arrives at its fair value.
Simply Wall St performs a discounted cash flow (DCF) on every stock in the world every day (check out Mongolian Mining for example). We show the entire calculation in full. You can track the result in your watchlist or portfolio and be alerted when this changes, or use our stock screener to discover 880 undervalued stocks based on their cash flows. If you save a screener we even alert you when new companies match - so you never miss a potential opportunity.
Build Your Own Mongolian Mining Narrative
If you see the numbers differently or prefer to base decisions on your own work, you can build a custom view in minutes with Do it your way.
A great starting point for your Mongolian Mining research is our analysis highlighting 1 important warning sign that could impact your investment decision.
Looking for more investment ideas?
If you stop with just one stock, you could miss opportunities sitting in plain sight, so put the screener to work and let it surface fresh ideas for you.
- Target potential mispricings by scanning these 880 undervalued stocks based on cash flows that align with your preferred mix of quality and price.
- Spot emerging themes in medicine and diagnostics by focusing on these 111 healthcare AI stocks that link data, software, and patient outcomes.
- Tap into digital assets from a different angle by checking out these 19 cryptocurrency and blockchain stocks that tie traditional markets to blockchain technology.
This article by Simply Wall St is general in nature. We provide commentary based on historical data and analyst forecasts only using an unbiased methodology and our articles are not intended to be financial advice. It does not constitute a recommendation to buy or sell any stock, and does not take account of your objectives, or your financial situation. We aim to bring you long-term focused analysis driven by fundamental data. Note that our analysis may not factor in the latest price-sensitive company announcements or qualitative material. Simply Wall St has no position in any stocks mentioned.
Have feedback on this article? Concerned about the content? Get in touch with us directly. Alternatively, email editorial-team@simplywallst.com
Contact Us
Contact Number :+852 3852 8500Webull Securities Limited is licensed with the Securities and Futures Commission of Hong Kong (CE No. BNG700) for carrying out Type 1 License for Dealing in Securities, Type 2 License for Dealing in Futures Contracts and Type 4 License for Advising on Securities.

English