
Has Teledyne Technologies (TDY) Already Priced In Its Strong Recent Share Price Gains?
- If you are wondering whether Teledyne Technologies at around US$610 per share is still reasonably valued, or if the easy gains are already behind it, you are not alone.
- The stock has recently posted returns of 5.0% over 7 days, 17.3% over 30 days, 17.7% year to date, and 18.7% over 1 year, with longer term returns of 44.6% over 3 years and 71.0% over 5 years. That naturally raises questions about what is already priced in.
- Recent attention on Teledyne has focused on its position as a high end technology and instrumentation player, with investors weighing its long term role in areas such as sensing, imaging, and digital imaging systems. That context helps frame the recent share price strength as the market reassesses how to value those capabilities.
- Even so, Teledyne currently scores only 1 out of 6 on our valuation checks. This suggests there is more to unpack using methods like DCFs, multiples, and peer comparisons, and we will finish by looking at a way to tie those valuation tools together.
Teledyne Technologies scores just 1/6 on our valuation checks. See what other red flags we found in the full valuation breakdown.
Approach 1: Teledyne Technologies Discounted Cash Flow (DCF) Analysis
The Discounted Cash Flow model projects Teledyne Technologies future cash flows and then discounts them back to what they are worth today, aiming to estimate an intrinsic value per share.
Teledyne is currently generating last twelve month free cash flow of about $1.08b. Analysts and internal estimates project free cash flow rising to around $1.77b by 2035, with specific points such as $1.18b in 2026 and $1.39b in 2028. Ten year projections beyond the initial analyst horizon are extrapolated by Simply Wall St using a 2 Stage Free Cash Flow to Equity model, which blends near term analyst input with longer run estimates.
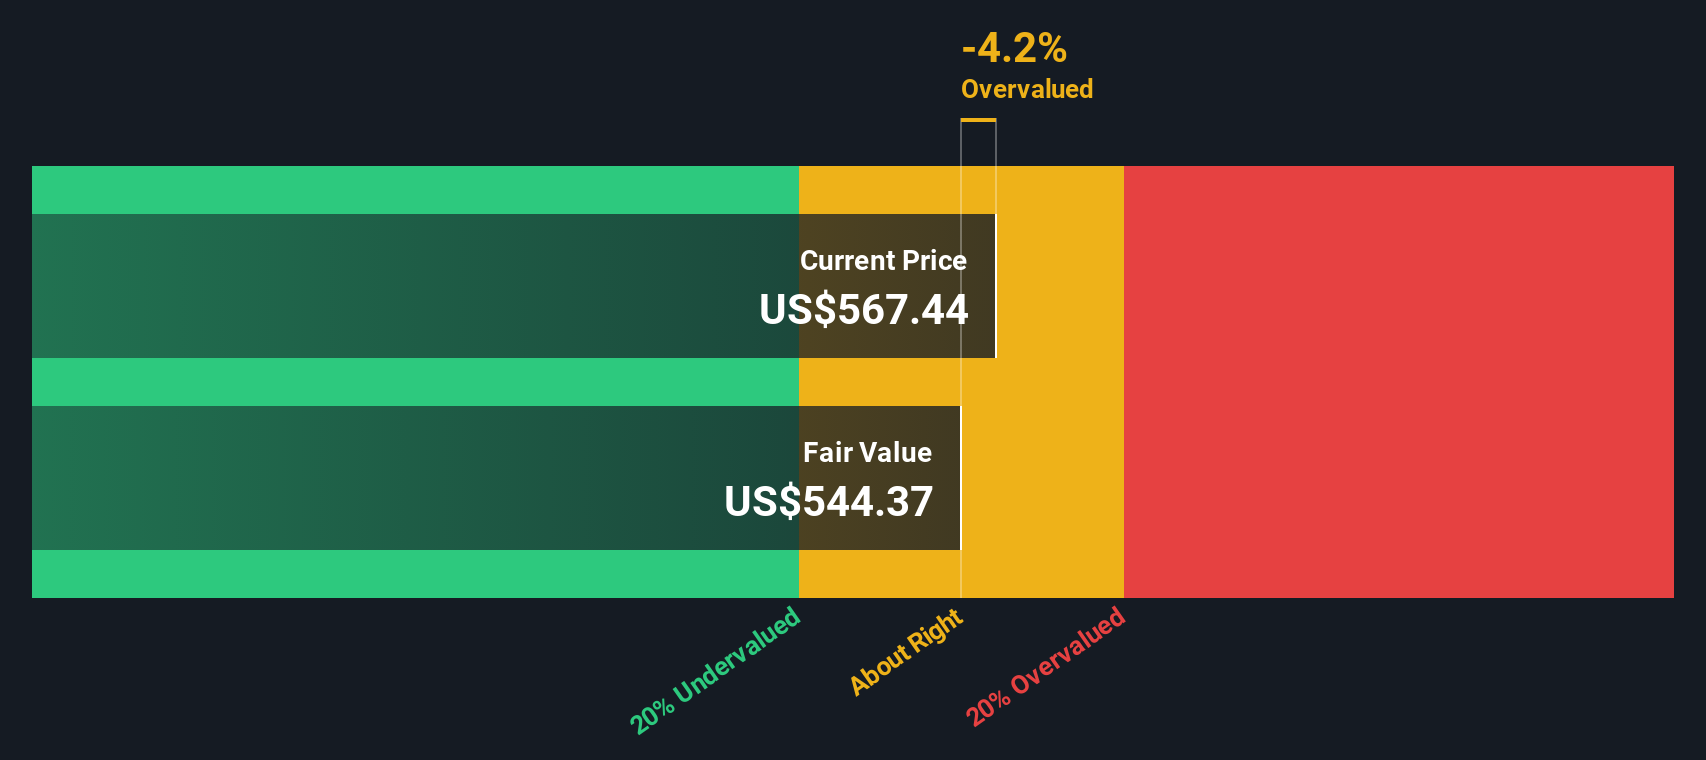
When all those projected cash flows are discounted back to today, the DCF model suggests an intrinsic value of about $519.67 per share. Against a current market price around $610, this implies the shares are roughly 17.5% above that DCF estimate, so on this measure Teledyne looks overvalued rather than cheap right now.
Result: OVERVALUED
Our Discounted Cash Flow (DCF) analysis suggests Teledyne Technologies may be overvalued by 17.5%. Discover 862 undervalued stocks or create your own screener to find better value opportunities.
Approach 2: Teledyne Technologies Price vs Earnings
For a profitable company like Teledyne Technologies, the P/E ratio is a useful way to see how much you are paying for each dollar of earnings. Investors tend to accept a higher or lower P/E depending on what they expect for future growth and how much risk they see in those earnings.
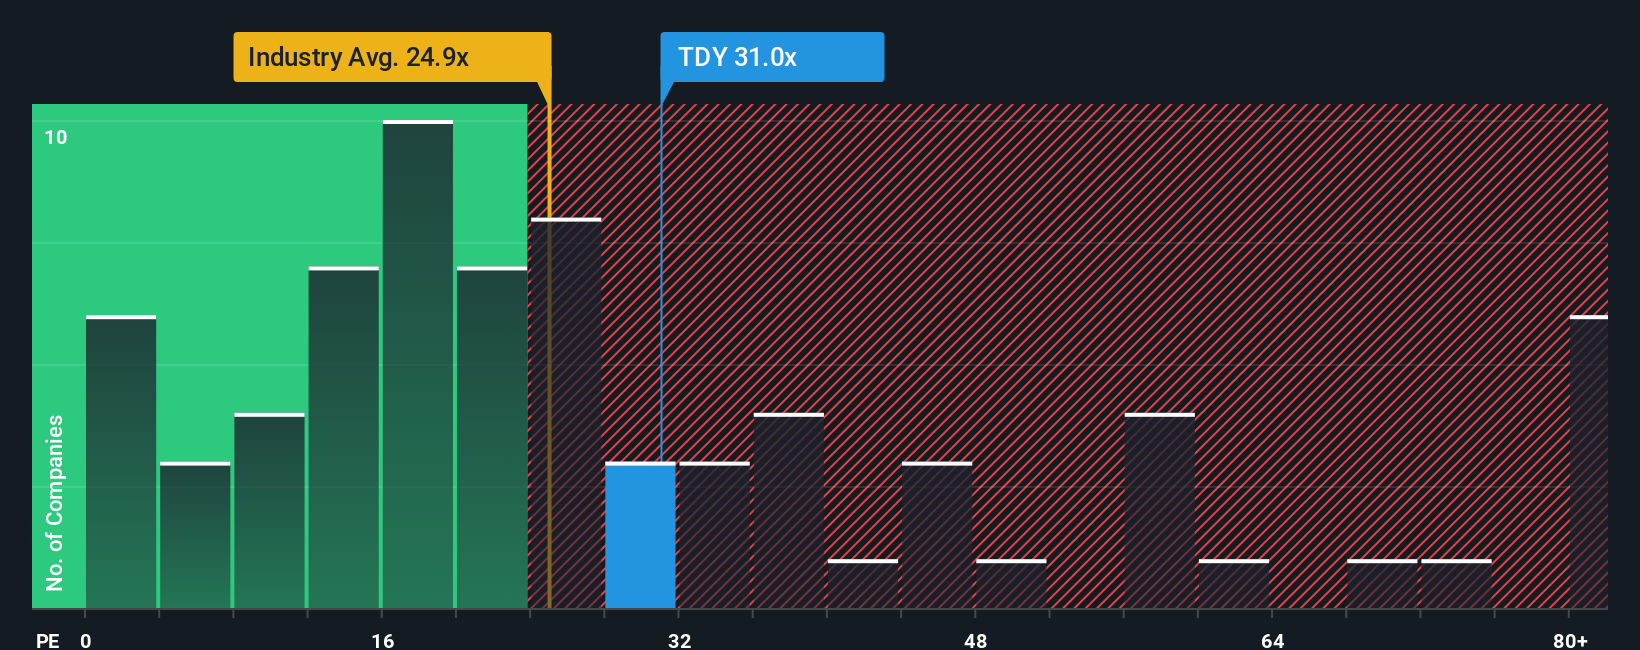
Teledyne currently trades on a P/E of 32.04x. That sits above the Electronic industry average of 26.93x and below the peer group average of 48.55x, so the market is valuing its earnings at a premium to the broader industry but not as highly as some peers.
Simply Wall St also calculates a “Fair Ratio” for Teledyne of 23.74x. This is a proprietary estimate of what the P/E might be given the company’s earnings growth profile, industry, profit margins, market cap and specific risks. Because it blends these company level factors rather than relying only on simple peer or industry comparisons, it can give a more tailored view of whether today’s multiple looks stretched or conservative.
Comparing the current P/E of 32.04x with the Fair Ratio of 23.74x suggests Teledyne is pricing in a higher multiple than that Fair Ratio implies.
Result: OVERVALUED
P/E ratios tell one story, but what if the real opportunity lies elsewhere? Discover 1421 companies where insiders are betting big on explosive growth.
Upgrade Your Decision Making: Choose your Teledyne Technologies Narrative
Earlier we mentioned that there is an even better way to understand valuation, so let us introduce you to Narratives, a simple way to link your view of Teledyne Technologies story to a financial forecast and then to a fair value. On Simply Wall St, within the Community page used by millions of investors, a Narrative is where you spell out what you think happens to a company’s revenue, earnings and margins, and the platform turns that into an estimated fair value that you can compare directly with today’s share price to help you decide whether to wait, start building a position, or consider taking profits. Narratives update automatically when new information like earnings releases or major news is added, so your fair value view keeps moving with the story instead of staying fixed to an old model. For Teledyne, one investor might see a relatively low fair value based on cautious revenue and margin assumptions, while another might set a higher fair value based on more optimistic expectations and be comfortable with a very different decision at the same share price.
Do you think there's more to the story for Teledyne Technologies? Head over to our Community to see what others are saying!
This article by Simply Wall St is general in nature. We provide commentary based on historical data and analyst forecasts only using an unbiased methodology and our articles are not intended to be financial advice. It does not constitute a recommendation to buy or sell any stock, and does not take account of your objectives, or your financial situation. We aim to bring you long-term focused analysis driven by fundamental data. Note that our analysis may not factor in the latest price-sensitive company announcements or qualitative material. Simply Wall St has no position in any stocks mentioned.
Have feedback on this article? Concerned about the content? Get in touch with us directly. Alternatively, email editorial-team@simplywallst.com
Contact Us
Contact Number : +852 3852 8500Webull Securities Limited is licensed with the Securities and Futures Commission of Hong Kong (CE No. BNG700) for carrying out Type 1 License for Dealing in Securities, Type 2 License for Dealing in Futures Contracts and Type 4 License for Advising on Securities.

English