
Is Zebra Technologies (ZBRA) Now Attractive After A 42% One-Year Share Price Slump?
- If you are wondering whether Zebra Technologies at around US$240.54 is a potential bargain or a value trap, you are not alone. The answer depends on how you look at its valuation.
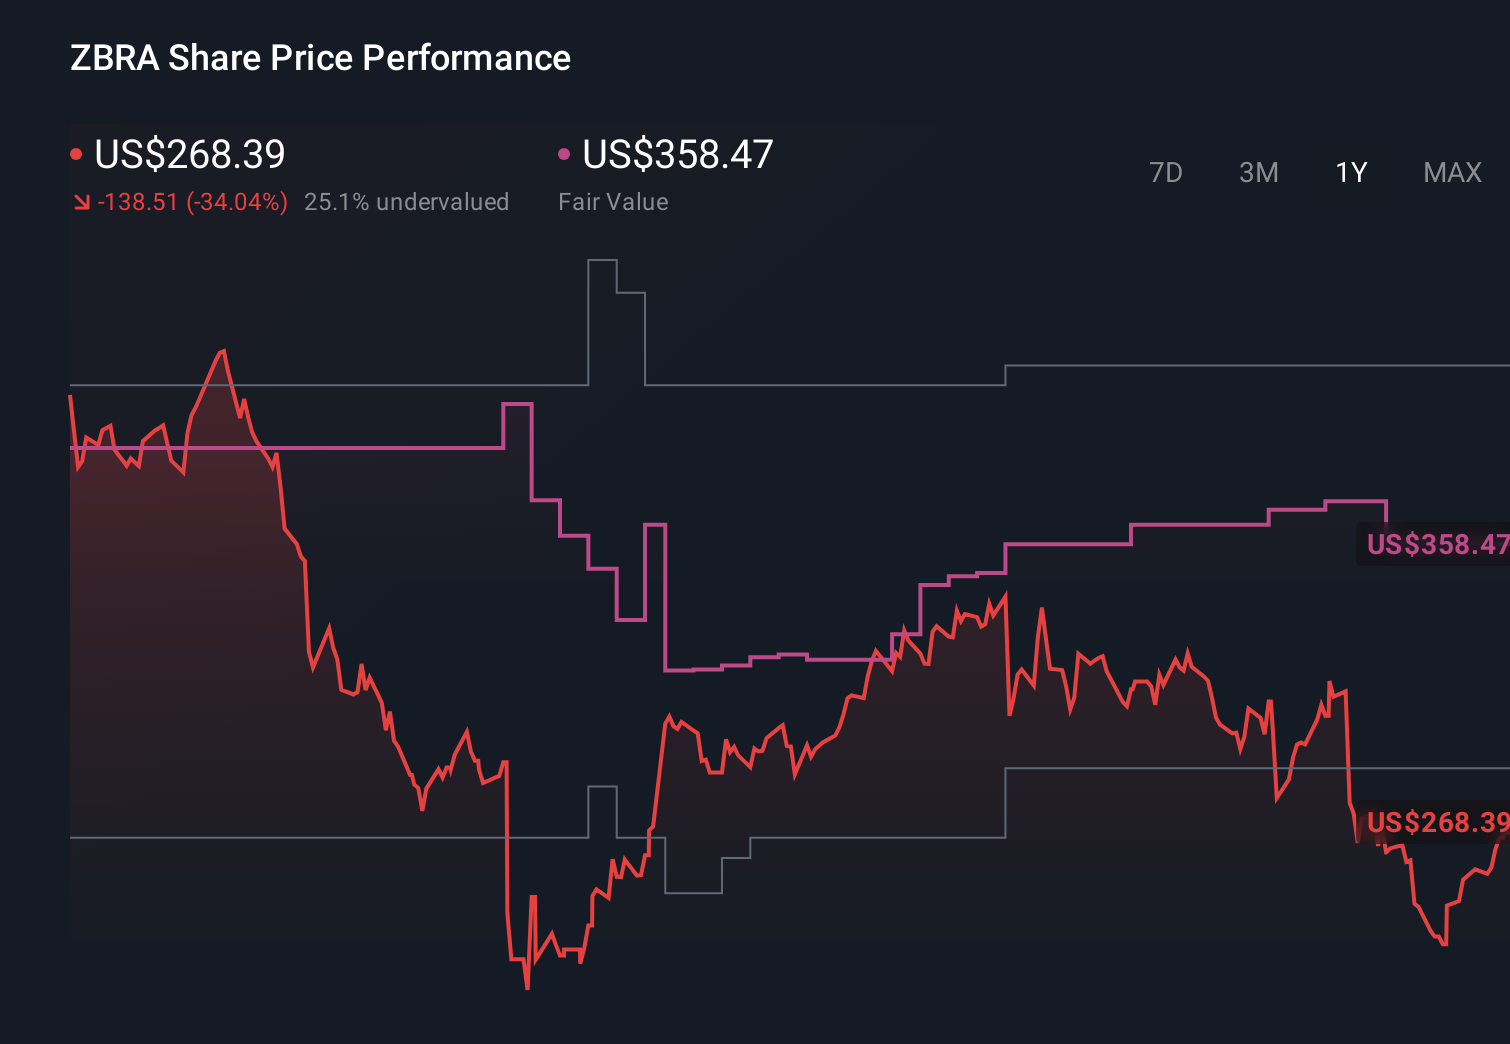
- The share price has seen a 4.2% decline over the last 7 days, a 2.3% decline over the last 30 days, a 3.1% decline year to date, and a 42.0% decline over the last year, with a 24.1% decline over 3 years and a 38.0% decline over 5 years, which may have changed how investors view both its upside and its risks.
- These moves sit against a backdrop of ongoing attention on barcode scanning, RFID, and data capture technology providers. Investors are weighing how much they are willing to pay for companies exposed to these themes. News around sector demand, customer spending plans, and broader tech sentiment continues to shape how the market prices Zebra Technologies, even when there is no single headline driving short term swings.
- Despite that mixed share price history, Zebra Technologies currently scores 6 out of 6 on our valuation checks. Next we will look at the usual valuation tools like P/E, cash flows and assets before finishing with a simpler way to make sense of what that score really means.
Find out why Zebra Technologies's -42.0% return over the last year is lagging behind its peers.
Approach 1: Zebra Technologies Discounted Cash Flow (DCF) Analysis
A Discounted Cash Flow, or DCF, model projects a company’s future cash flows and then discounts them back to today’s dollars, aiming to estimate what the business might be worth right now.
For Zebra Technologies, the model here is a 2 Stage Free Cash Flow to Equity approach. The company’s latest twelve month free cash flow is about $786.8 million. Analysts provide explicit free cash flow estimates for the earlier years, and Simply Wall St extrapolates further out, including a projection of $1,059.0 million in free cash flow by 2029 and additional estimates through 2035, all in $.
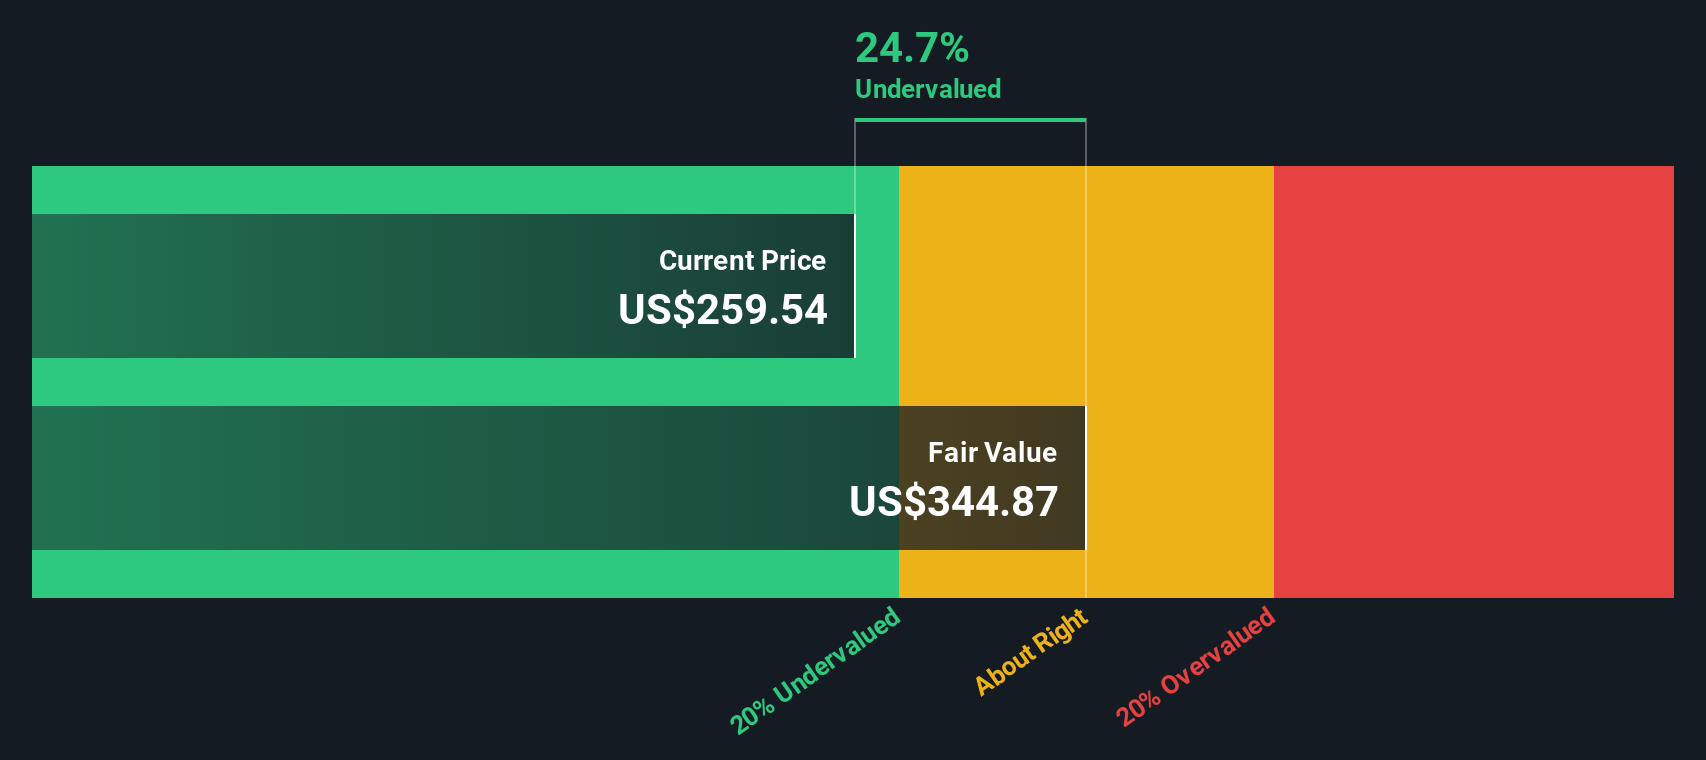
After discounting those projected cash flows back to today, the DCF model suggests an estimated intrinsic value of about $341.37 per share. Compared with the current share price of around $240.54, the model implies the stock is 29.5% undervalued based on these assumptions and inputs.
Result: UNDERVALUED
Our Discounted Cash Flow (DCF) analysis suggests Zebra Technologies is undervalued by 29.5%. Track this in your watchlist or portfolio, or discover 873 more undervalued stocks based on cash flows.
Approach 2: Zebra Technologies Price vs Earnings
For a profitable company, the P/E ratio is a straightforward way to see how much you are paying for each dollar of current earnings, which is why it is often the first check investors use on stocks like Zebra Technologies.
What counts as a "normal" P/E depends a lot on what the market expects for future growth and how risky those earnings appear. Higher expected growth and lower perceived risk can justify a higher multiple, while slower growth or higher uncertainty usually point to a lower one.
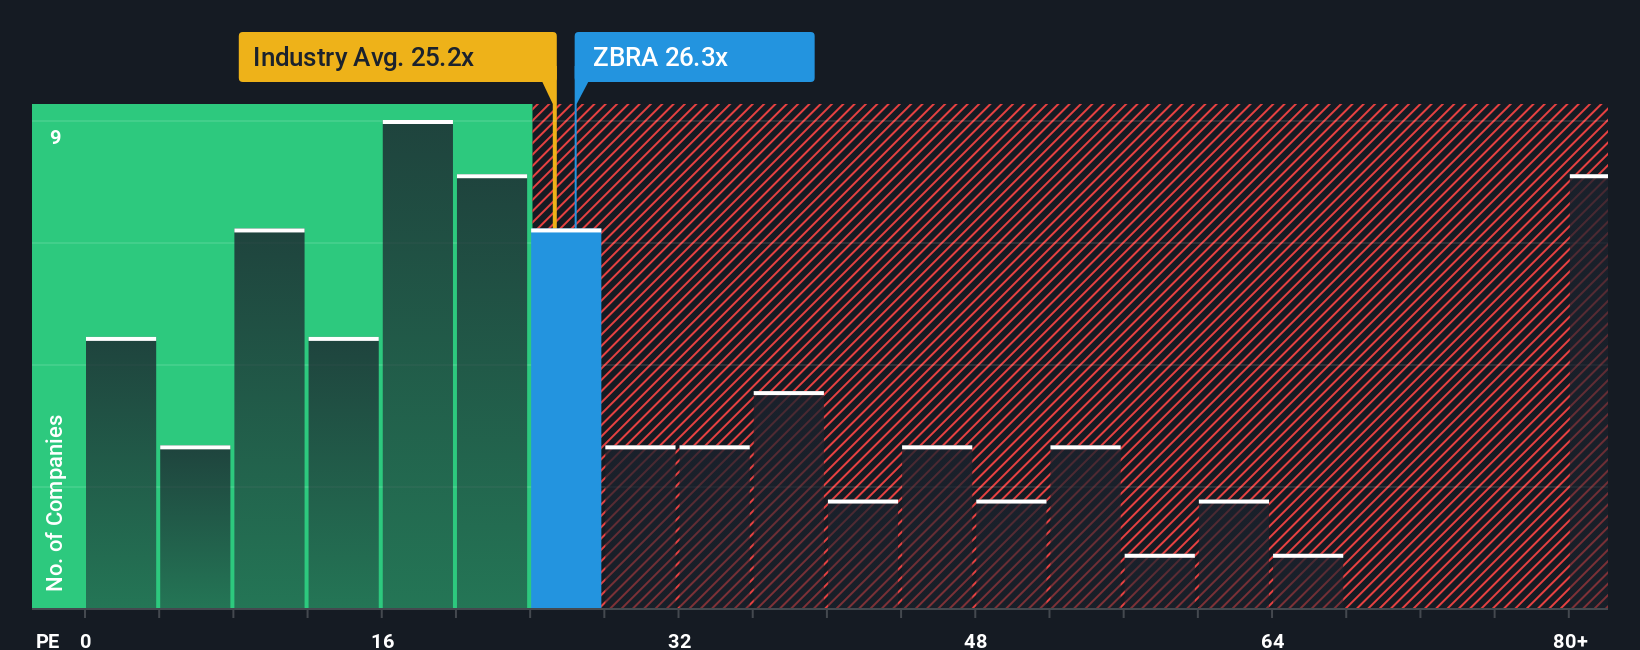
Zebra Technologies currently trades on a P/E of 23.8x. That sits below the Electronic industry average of 26.93x and also below the broader peer group average of 46.58x. Simply Wall St’s Fair Ratio for Zebra Technologies is 29.61x, which is its own estimate of what the P/E "should" be given factors such as earnings growth profile, industry, profit margins, market cap and company specific risks.
This Fair Ratio is more tailored than a simple peer or industry comparison, because it adjusts for Zebra Technologies specific characteristics instead of assuming that all companies deserve similar multiples.
Result: UNDERVALUED
P/E ratios tell one story, but what if the real opportunity lies elsewhere? Discover 1429 companies where insiders are betting big on explosive growth.
Upgrade Your Decision Making: Choose your Zebra Technologies Narrative
Earlier we mentioned that there is an even better way to understand valuation, so let us introduce you to Narratives, a simple way to connect your view of Zebra Technologies with the numbers behind it.
A Narrative is your story for the company, where you spell out what you think happens to its revenue, earnings and margins over time, and then see what fair value those assumptions point to.
On Simply Wall St, within the Community page used by millions of investors, Narratives link that story to a financial forecast and then to a fair value that you can compare directly with today’s share price to help you decide whether you prefer to buy, hold, or sell.
The tool updates when new information like news or earnings is added. You can also see a range of Narratives for Zebra Technologies side by side. For example, one investor might see a very cautious fair value, while another might see a far higher figure based on stronger long term revenue and margin expectations.
Do you think there's more to the story for Zebra Technologies? Head over to our Community to see what others are saying!
This article by Simply Wall St is general in nature. We provide commentary based on historical data and analyst forecasts only using an unbiased methodology and our articles are not intended to be financial advice. It does not constitute a recommendation to buy or sell any stock, and does not take account of your objectives, or your financial situation. We aim to bring you long-term focused analysis driven by fundamental data. Note that our analysis may not factor in the latest price-sensitive company announcements or qualitative material. Simply Wall St has no position in any stocks mentioned.
Have feedback on this article? Concerned about the content? Get in touch with us directly. Alternatively, email editorial-team@simplywallst.com
Contact Us
Contact Number : +852 3852 8500Webull Securities Limited is licensed with the Securities and Futures Commission of Hong Kong (CE No. BNG700) for carrying out Type 1 License for Dealing in Securities, Type 2 License for Dealing in Futures Contracts and Type 4 License for Advising on Securities.

English