
Assessing East Buy Holding (SEHK:1797) Valuation As Earnings Anticipation Drives Recent Share Price Strength
Why East Buy Holding (SEHK:1797) is in focus ahead of earnings
East Buy Holding (SEHK:1797) is drawing attention as it heads into its 28 January 2026 earnings release, with investors closely watching revenue growth, margin trends and management guidance.
See our latest analysis for East Buy Holding.
At a share price of HK$23.08, East Buy Holding has recently seen a 27.73% 1 month share price return and a 44.97% 1 year total shareholder return. However, the 3 year total shareholder return of a 65% decline shows longer term momentum has been weaker, even as traders focus on the upcoming earnings update.
If this kind of move has you looking beyond a single stock, it could be a good moment to scan fast growing stocks with high insider ownership as another way to spot potential opportunities.
With the share price well above the average analyst target yet still trading at a discount to one intrinsic value estimate, the key question now is whether East Buy is mispriced or whether the market already reflects future growth.
Preferred Price-to-Sales of 4.9x: Is it justified?
On a P/S basis, East Buy Holding looks expensive at 4.9x, especially when you set that against the last close of HK$23.08 and the wider peer group.
The P/S ratio compares the company’s market value to its revenue, so a higher multiple usually suggests the market is placing a richer value on each unit of sales. For East Buy, that sits against forecast revenue growth of 15% per year, alongside earnings that analysts expect to grow much faster than the Hong Kong market.
What stands out is how far this multiple sits above the benchmarks. East Buy trades at 4.9x sales, compared with an estimated fair P/S of 1.6x that our model suggests the market could move toward, and against a Hong Kong Consumer Retailing industry average of 0.7x and peer average of 0.8x. That is a steep premium for a business currently reporting a 0.1% net margin and low Return on Equity, so investors watching the upcoming earnings release may focus on whether profitability trends start to close that gap.
Explore the SWS fair ratio for East Buy Holding
Result: Price-to-Sales of 4.9x (OVERVALUED)
However, the combination of a 4.9x P/S multiple and a 0.1% net margin leaves little room for disappointment if revenue or profitability miss expectations.
Find out about the key risks to this East Buy Holding narrative.
Another View: DCF points in the opposite direction
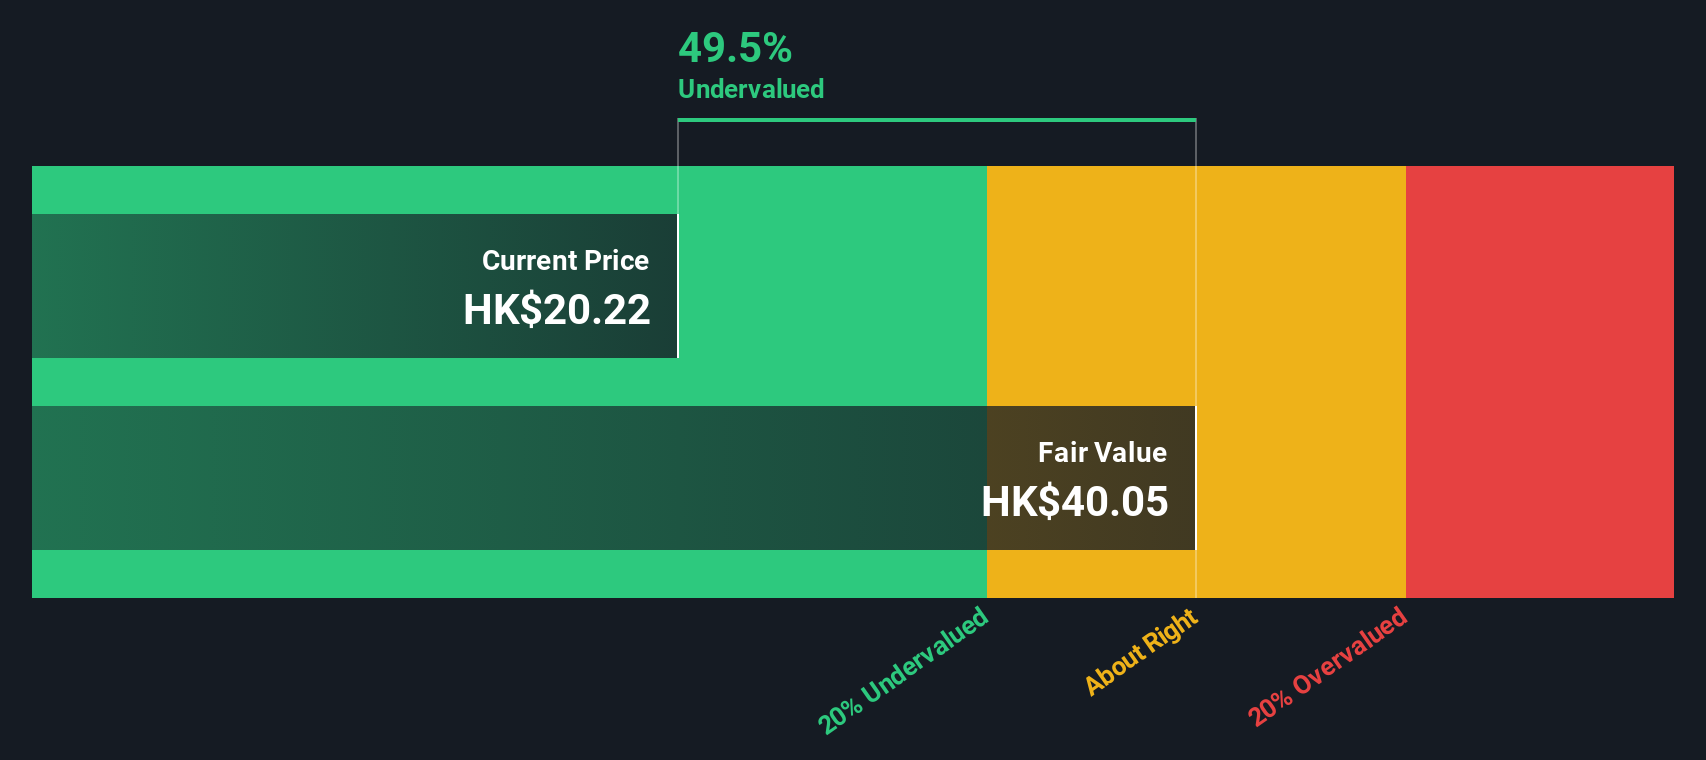
While the 4.9x P/S ratio presents East Buy as expensive, our DCF model suggests the opposite. It indicates a fair value estimate of HK$41.01 compared with the current price of HK$23.08. That implies the shares trade at about a 44% discount. The key question is which signal should carry more weight in your analysis.
Look into how the SWS DCF model arrives at its fair value.
Simply Wall St performs a discounted cash flow (DCF) on every stock in the world every day (check out East Buy Holding for example). We show the entire calculation in full. You can track the result in your watchlist or portfolio and be alerted when this changes, or use our stock screener to discover 876 undervalued stocks based on their cash flows. If you save a screener we even alert you when new companies match - so you never miss a potential opportunity.
Build Your Own East Buy Holding Narrative
If you see the numbers differently or prefer to rely on your own work, you can quickly build and stress test a personalised thesis using Do it your way.
A great starting point for your East Buy Holding research is our analysis highlighting 2 key rewards and 2 important warning signs that could impact your investment decision.
Looking for more investment ideas?
If East Buy is on your radar, do not stop there. Use targeted screeners to quickly surface other opportunities that fit the way you like to invest.
- Spot potential value gaps by scanning these 876 undervalued stocks based on cash flows that may be trading below what their cash flows suggest.
- Ride the AI trend more deliberately by filtering for these 23 AI penny stocks with exposure to artificial intelligence themes.
- Turn income into a focus by zeroing in on these 14 dividend stocks with yields > 3% that might suit a yield oriented portfolio.
This article by Simply Wall St is general in nature. We provide commentary based on historical data and analyst forecasts only using an unbiased methodology and our articles are not intended to be financial advice. It does not constitute a recommendation to buy or sell any stock, and does not take account of your objectives, or your financial situation. We aim to bring you long-term focused analysis driven by fundamental data. Note that our analysis may not factor in the latest price-sensitive company announcements or qualitative material. Simply Wall St has no position in any stocks mentioned.
Have feedback on this article? Concerned about the content? Get in touch with us directly. Alternatively, email editorial-team@simplywallst.com
Contact Us
Contact Number :+852 3852 8500Webull Securities Limited is licensed with the Securities and Futures Commission of Hong Kong (CE No. BNG700) for carrying out Type 1 License for Dealing in Securities, Type 2 License for Dealing in Futures Contracts and Type 4 License for Advising on Securities.

English