
Has Coherent (COHR) Rallied Too Far After Surging 141% In One Year?
- If you are wondering whether Coherent's share price reflects its real worth or if expectations have simply run ahead of themselves, this article is designed to help you frame that question clearly.
- The stock most recently closed at US$215.86, with returns of 6.5% over 7 days, 15.6% over 30 days, 11.1% year to date, 140.7% over 1 year and 366.6% over 3 years. These figures naturally raise questions about growth potential and how risk is being priced in.
- Recent coverage around Coherent has focused on the broader interest in advanced laser and photonics applications, regulations affecting high tech exports and ongoing industry investment themes. All of these can influence how investors think about the stock. These kinds of narratives often shape sentiment and help explain why a share price moves as much as the recent returns suggest.
- Despite this backdrop, Coherent currently has a valuation score of 0 out of 6. We will look at what different valuation methods say about the stock, and later on consider an even more useful way to think about its valuation in context.
Coherent scores just 0/6 on our valuation checks. See what other red flags we found in the full valuation breakdown.
Approach 1: Coherent Discounted Cash Flow (DCF) Analysis
A Discounted Cash Flow, or DCF, model estimates what a company might be worth by projecting its future cash flows and discounting them back to today’s dollars. It is essentially asking what all of Coherent’s future cash generation is worth in today’s terms.
For Coherent, the model used is a 2 Stage Free Cash Flow to Equity approach, based on cash flow projections. The latest twelve month free cash flow is about US$75.2 million. Analysts provide free cash flow estimates up to 2028, with Simply Wall St extrapolating the remaining years out to 2035. By 2035, the projection used in the model is free cash flow of about US$2.0 billion, with each year between now and then discounted back to today.
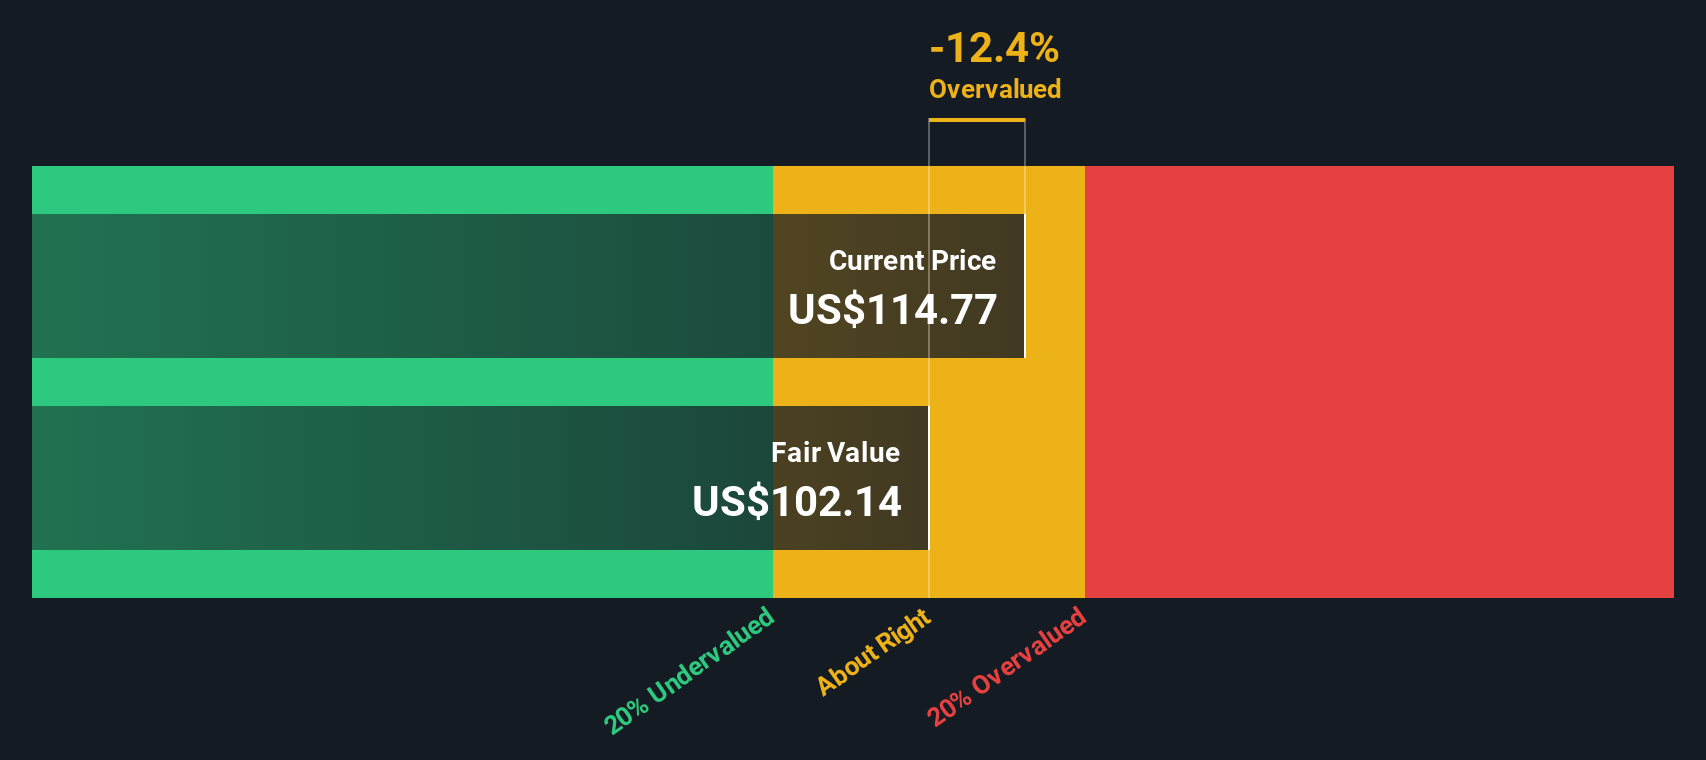
Adding these discounted cash flows together gives an estimated intrinsic value of US$148.62 per share. Compared with the recent share price of US$215.86, the DCF output suggests Coherent is about 45.2% overvalued on this set of assumptions.
Result: OVERVALUED
Our Discounted Cash Flow (DCF) analysis suggests Coherent may be overvalued by 45.2%. Discover 865 undervalued stocks or create your own screener to find better value opportunities.
Approach 2: Coherent Price vs Sales
For companies where investors focus heavily on revenue potential, the P/S ratio can be a useful way to think about valuation, because it compares what the market is paying to the sales the business is already generating.
What counts as a “normal” or “fair” P/S ratio usually reflects expectations for future growth and the level of risk that comes with those expectations. Higher anticipated growth or lower perceived risk can justify a higher multiple, while lower growth or higher risk tends to pull that multiple down.
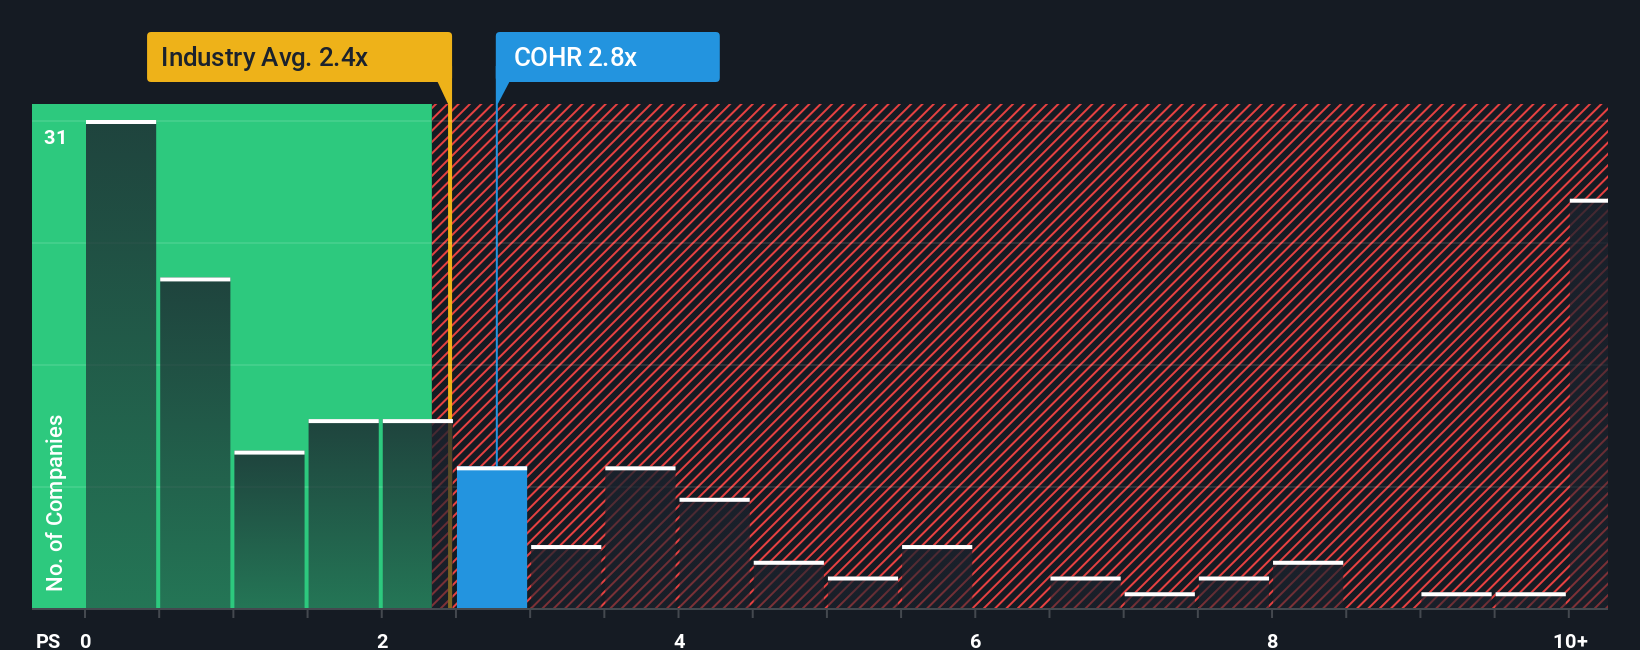
Coherent is currently trading on a P/S ratio of 6.10x. That sits above the Electronic industry average P/S of 2.86x and also above the peer average of 4.61x. This suggests investors are willing to pay a premium compared to many similar businesses. Simply Wall St’s Fair Ratio for Coherent is 3.96x. This is the P/S level their model suggests when it factors in elements such as earnings growth, industry, profit margins, market cap and key risks.
The Fair Ratio is more tailored than a simple comparison with peers or the wider industry because it adjusts for those company specific characteristics rather than assuming all firms deserve the same multiple. With the current P/S of 6.10x sitting well above the Fair Ratio of 3.96x, this framework points to the shares looking expensive on a sales basis.
Result: OVERVALUED
P/S ratios tell one story, but what if the real opportunity lies elsewhere? Discover 1412 companies where insiders are betting big on explosive growth.
Upgrade Your Decision Making: Choose your Coherent Narrative
Earlier we mentioned that there is an even better way to understand valuation, so let us introduce you to Narratives, which are simply your story about a company linked directly to your assumptions about its future revenue, earnings, margins and fair value. On Simply Wall St’s Community page, you can build a Narrative for Coherent by setting your own expectations, which the platform then turns into a forecast and a Fair Value that you can compare with the current share price to help you decide whether the stock looks attractive or not right now. Narratives are updated automatically when new information like earnings reports or major news is added, so your story and numbers stay aligned without extra work. For Coherent, one investor might build a Narrative that expects very strong revenue growth and robust margins, which would lead to a much higher Fair Value than today’s price. Another investor might assume more modest growth and thinner margins, resulting in a lower Fair Value that sits below the current price.
Do you think there's more to the story for Coherent? Head over to our Community to see what others are saying!

This article by Simply Wall St is general in nature. We provide commentary based on historical data and analyst forecasts only using an unbiased methodology and our articles are not intended to be financial advice. It does not constitute a recommendation to buy or sell any stock, and does not take account of your objectives, or your financial situation. We aim to bring you long-term focused analysis driven by fundamental data. Note that our analysis may not factor in the latest price-sensitive company announcements or qualitative material. Simply Wall St has no position in any stocks mentioned.
Have feedback on this article? Concerned about the content? Get in touch with us directly. Alternatively, email editorial-team@simplywallst.com
Contact Us
Contact Number : +852 3852 8500Webull Securities Limited is licensed with the Securities and Futures Commission of Hong Kong (CE No. BNG700) for carrying out Type 1 License for Dealing in Securities, Type 2 License for Dealing in Futures Contracts and Type 4 License for Advising on Securities.

English