
Is It Time To Reconsider Itron (ITRI) After Recent Share Price Pullback?
- If you are wondering whether Itron is fairly priced or offering value right now, you are not alone. The starting point is to understand what the recent share performance is really telling you.
- The stock last closed at US$100.19, with returns of 0.5% over the past week, 6.3% over the past month, 6.1% year to date, and a 6.8% decline over the past year. The 3 year return sits at 67.3% and the 5 year return at 1.7%.
- Recent coverage of Itron has focused on its role in providing technology for utilities, including its smart metering and grid management offerings. This often shapes how investors think about its long term demand profile. This context can help explain why the market has reassessed the share price at different points, as expectations around utility spending and infrastructure projects have shifted.
- Itron currently has a valuation score of 6 out of 6, which means it screens as undervalued on each of the six checks we apply. Next we will look at how standard valuation approaches line up with that result before turning to a more complete way of thinking about value later in the article.
Find out why Itron's -6.8% return over the last year is lagging behind its peers.
Approach 1: Itron Discounted Cash Flow (DCF) Analysis
A Discounted Cash Flow, or DCF, model estimates what a company might be worth by projecting its future cash flows and then discounting those back to today to reflect time and risk.
For Itron, the model used is a 2 Stage Free Cash Flow to Equity approach. The latest twelve month free cash flow is about $339.38 million. Analysts provide specific forecasts out to 2028, with Simply Wall St extrapolating further, and the projection for 2035 free cash flow is $737.15 million. All of these cash flows are in US dollars and remain below $1b, so it is helpful to think of them in millions.
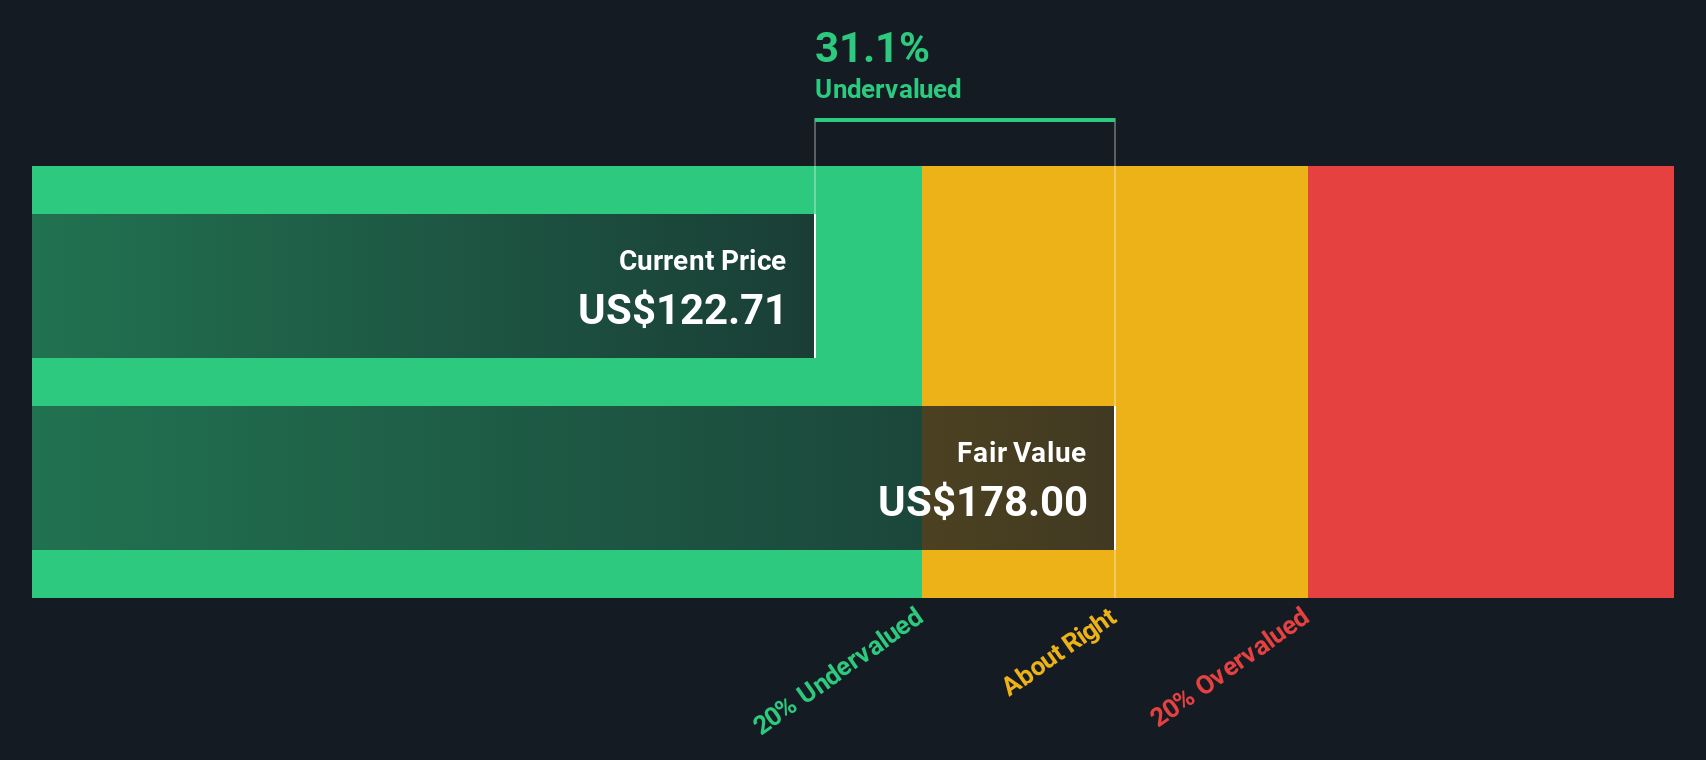
After discounting these projected cash flows, the model arrives at an estimated intrinsic value of about $189.45 per share. Compared with the recent share price of $100.19, this suggests the stock appears around 47.1% undervalued under this DCF framework.
Result: UNDERVALUED
Our Discounted Cash Flow (DCF) analysis suggests Itron is undervalued by 47.1%. Track this in your watchlist or portfolio, or discover 869 more undervalued stocks based on cash flows.
Approach 2: Itron Price vs Earnings
For a profitable company like Itron, the P/E ratio is a useful way to think about value because it links what you pay for the stock to the earnings the business is generating today. A higher or lower P/E is not good or bad on its own; it usually reflects how the market is weighing growth prospects against business and financial risk.
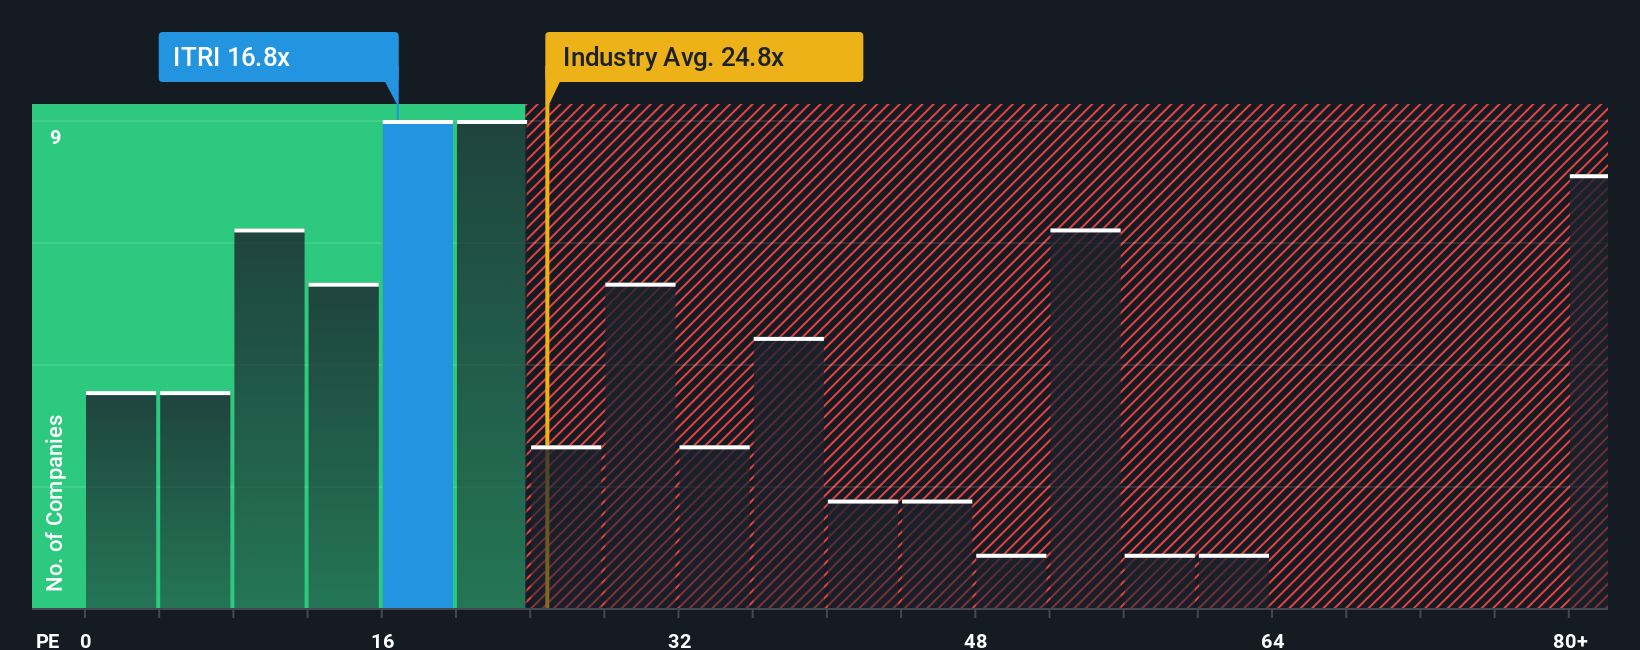
Itron currently trades on a P/E of 17.45x. That sits below the Electronic industry average P/E of 27.64x and also below the peer average of 42.15x included in this data set. To tighten that comparison, Simply Wall St calculates a proprietary “Fair Ratio” for Itron of 22.36x. This is the preferred multiple that would typically be expected given factors such as its earnings growth profile, industry, profit margins, market cap and risk characteristics.
The Fair Ratio is more tailored than a simple industry or peer comparison because it adjusts for company specific features rather than assuming all peers deserve similar valuations. Setting the Fair Ratio of 22.36x against the current P/E of 17.45x suggests Itron’s earnings multiple sits below that model based estimate.
Result: UNDERVALUED
P/E ratios tell one story, but what if the real opportunity lies elsewhere? Discover 1418 companies where insiders are betting big on explosive growth.
Upgrade Your Decision Making: Choose your Itron Narrative
Earlier we mentioned that there is an even better way to understand valuation, so let us introduce you to Narratives, which are simply your story about Itron joined to the numbers you think are reasonable for its future revenue, earnings, margins and fair value.
A Narrative on Simply Wall St links three pieces together: the company story you believe, the financial forecast that story implies, and the fair value that follows from those assumptions.
You can build and compare Narratives on the Community page of Simply Wall St, where millions of investors share their views. You can then use the gap between fair value and the current price to help decide whether Itron looks too expensive, too cheap or roughly in line with your expectations.
Because Narratives update when new information such as news or earnings is added to the platform, your view on Itron can stay current without you rebuilding your work from scratch. You will often see one investor with a cautious Narrative and lower fair value sitting alongside another with a more optimistic Narrative and higher fair value, both looking at the same stock price but reaching very different conclusions about what to do next.
Do you think there's more to the story for Itron? Head over to our Community to see what others are saying!

This article by Simply Wall St is general in nature. We provide commentary based on historical data and analyst forecasts only using an unbiased methodology and our articles are not intended to be financial advice. It does not constitute a recommendation to buy or sell any stock, and does not take account of your objectives, or your financial situation. We aim to bring you long-term focused analysis driven by fundamental data. Note that our analysis may not factor in the latest price-sensitive company announcements or qualitative material. Simply Wall St has no position in any stocks mentioned.
Have feedback on this article? Concerned about the content? Get in touch with us directly. Alternatively, email editorial-team@simplywallst.com
Contact Us
Contact Number : +852 3852 8500Webull Securities Limited is licensed with the Securities and Futures Commission of Hong Kong (CE No. BNG700) for carrying out Type 1 License for Dealing in Securities, Type 2 License for Dealing in Futures Contracts and Type 4 License for Advising on Securities.

English