
Is It Time To Reconsider Ralliant (RAL) After Recent Tech Partnership Updates?
- If you are wondering whether Ralliant's current share price gives you good value for your money, you are not alone. This article is built to help you assess that.
- Over the short term, the stock has seen a 1.4% decline over the past week, a 4.0% gain over the last 30 days and a 3.4% return year to date, which has likely caught the attention of investors tracking short term moves.
- Recent coverage has focused on Ralliant's position in the tech sector and how investors are reacting to its latest operational updates, partnerships and product rollouts. This context helps explain why some traders are responding quickly to new headlines while longer term holders are watching for a clearer direction.
- Ralliant currently scores 2 out of 6 on our valuation checks. This means it screens as undervalued on only a subset of the tests we run. Next, we will compare what different valuation approaches say about the stock and then finish with a way to tie all of that into a clearer view of value over time.
Ralliant scores just 2/6 on our valuation checks. See what other red flags we found in the full valuation breakdown.
Approach 1: Ralliant Discounted Cash Flow (DCF) Analysis
A Discounted Cash Flow, or DCF, model takes estimates of the cash Ralliant could generate in the future and discounts those back to what they might be worth today, using a required rate of return.
For Ralliant, the model uses a 2 Stage Free Cash Flow to Equity approach based on cash flow projections. The latest twelve month free cash flow is $422.61 million, and analysts provide forecasts that extend out to 2028. Beyond those analyst inputs, Simply Wall St extrapolates additional yearly free cash flow figures, reaching an estimated $424.91 million in 2035. These are then discounted back to today using the chosen rate.
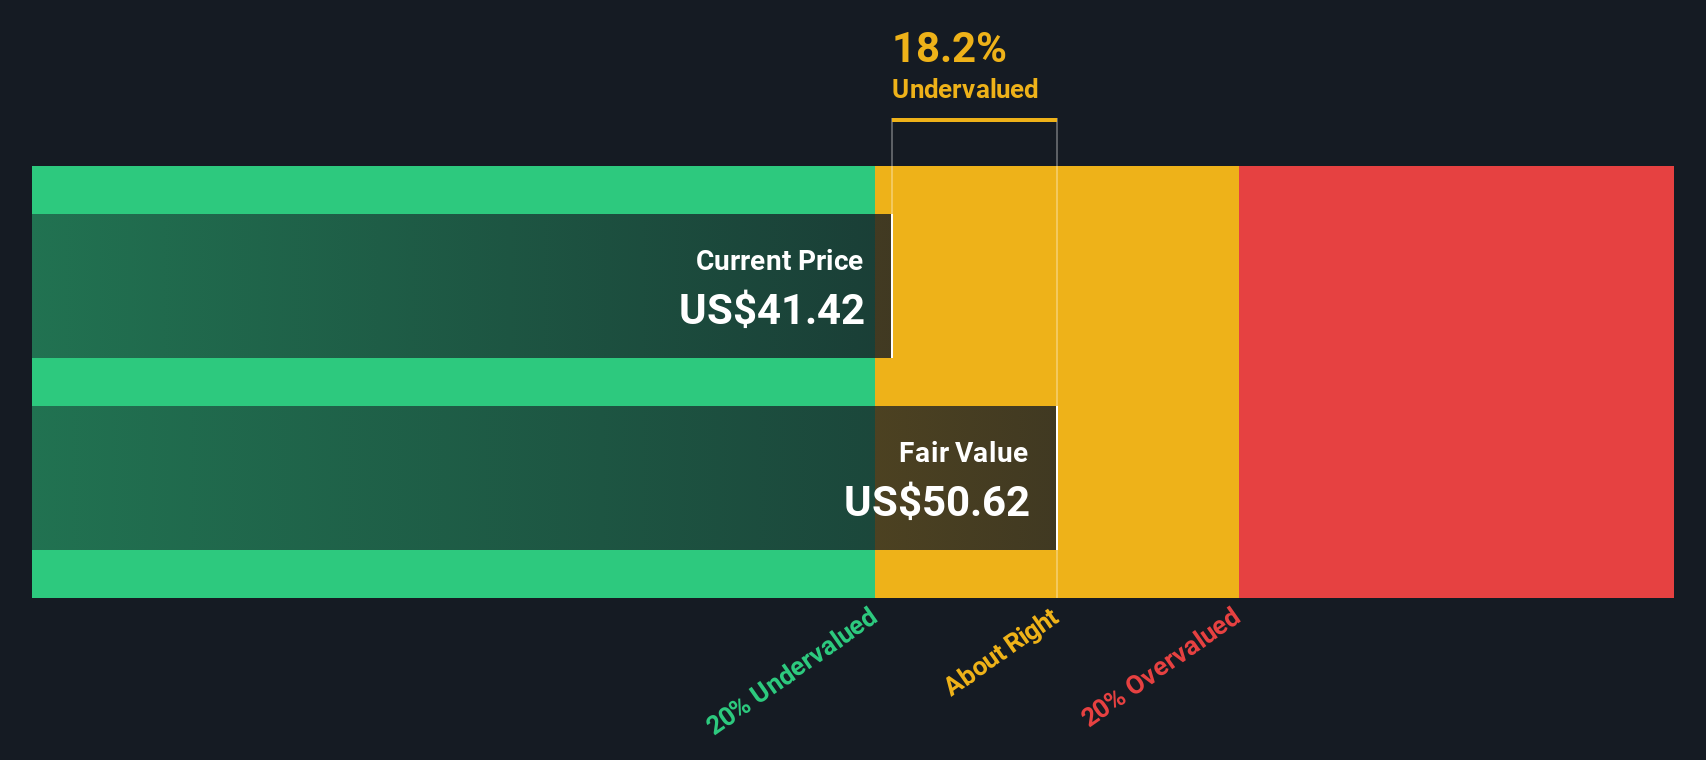
Putting all of those discounted cash flows together gives an estimated intrinsic value of $50.51 per share. Compared with the current share price, the DCF output suggests the stock is about 4.9% overvalued. This is a relatively small gap and points to pricing that is close to the model’s estimate of fair value.
Result: ABOUT RIGHT
Ralliant is fairly valued according to our Discounted Cash Flow (DCF), but this can change at a moment's notice. Track the value in your watchlist or portfolio and be alerted on when to act.
Approach 2: Ralliant Price vs Earnings (P/E)
For a profitable business like Ralliant, the P/E ratio is a straightforward way to think about value because it links what you pay today to the earnings the company is already generating. Investors typically accept a higher P/E when they see stronger growth potential or lower perceived risk, and look for a lower P/E when growth expectations are more modest or risk feels higher.
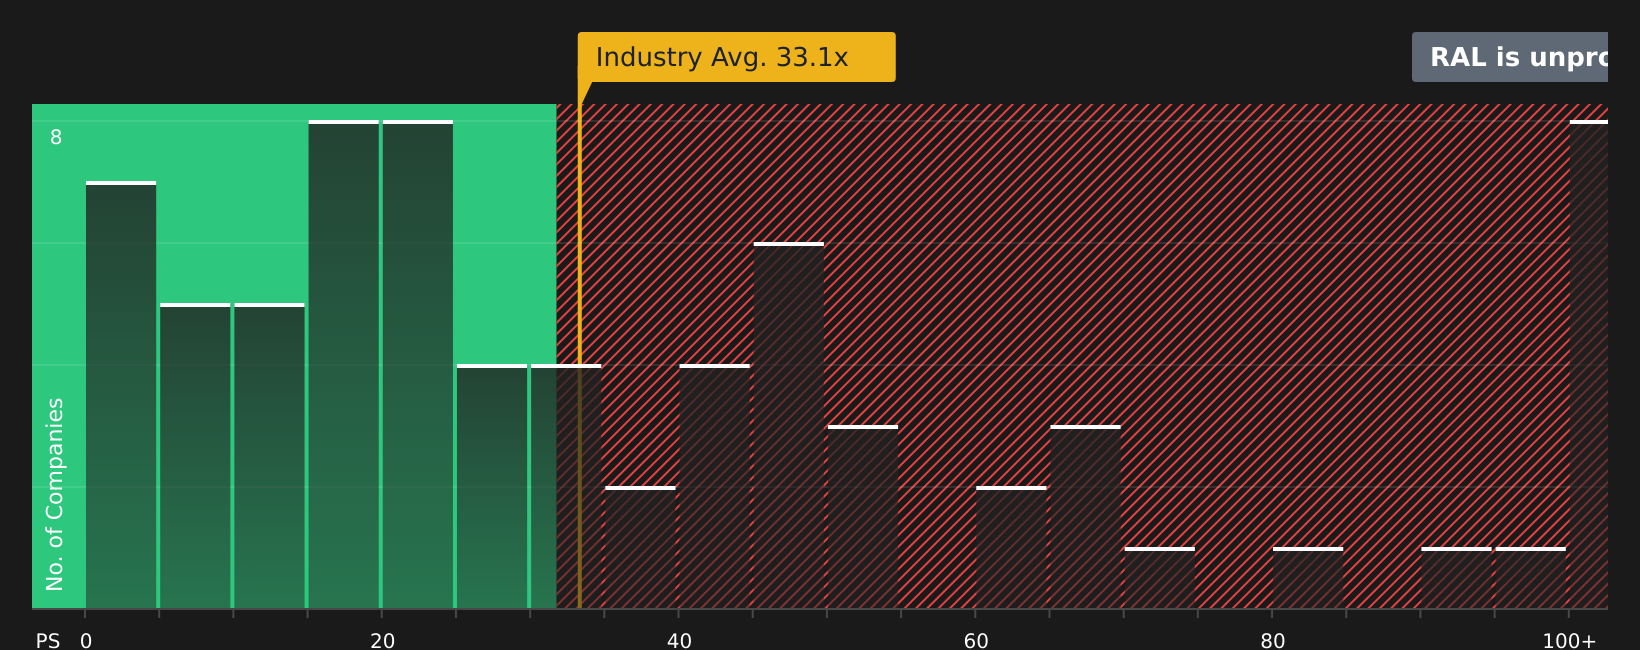
Ralliant currently trades on a P/E of 25.5x. That sits below the Electronic industry average of 27.6x, and well below the 47.8x peer average provided. On the surface, that might look like a discount, but simple comparisons like this do not adjust for the company’s own mix of earnings growth, margins, size and risk.
Simply Wall St’s Fair Ratio for Ralliant is 22.7x. This is its proprietary view of what a reasonable P/E might be after taking those factors into account. Because the Fair Ratio is tailored to Ralliant’s characteristics, it can be more informative than a broad industry or peer comparison. With the current P/E slightly above the 22.7x Fair Ratio, the multiple points to Ralliant trading a bit richer than that customised reference point.
Result: OVERVALUED
P/E ratios tell one story, but what if the real opportunity lies elsewhere? Discover 1416 companies where insiders are betting big on explosive growth.
Upgrade Your Decision Making: Choose your Ralliant Narrative
Earlier we mentioned that there is an even better way to understand valuation, so let us introduce you to Narratives, which are simply your own story about Ralliant linked directly to numbers like fair value, future revenue, earnings and margins. On Simply Wall St’s Community page, used by millions of investors, you can pick or create a Narrative that connects what you believe about Ralliant’s products, competition and execution to a clear financial forecast and an estimated fair value, then compare that fair value to today’s share price to decide whether the stock looks attractive or stretched. Narratives are kept current as new information such as earnings or news comes through, so your view on Ralliant is not frozen at one point in time. For example, one Ralliant Narrative might assume very strong revenue growth and high margins while another might assume slower growth and more modest margins, leading to very different fair values and decisions.
Do you think there's more to the story for Ralliant? Head over to our Community to see what others are saying!

This article by Simply Wall St is general in nature. We provide commentary based on historical data and analyst forecasts only using an unbiased methodology and our articles are not intended to be financial advice. It does not constitute a recommendation to buy or sell any stock, and does not take account of your objectives, or your financial situation. We aim to bring you long-term focused analysis driven by fundamental data. Note that our analysis may not factor in the latest price-sensitive company announcements or qualitative material. Simply Wall St has no position in any stocks mentioned.
Have feedback on this article? Concerned about the content? Get in touch with us directly. Alternatively, email editorial-team@simplywallst.com
Contact Us
Contact Number : +852 3852 8500Webull Securities Limited is licensed with the Securities and Futures Commission of Hong Kong (CE No. BNG700) for carrying out Type 1 License for Dealing in Securities, Type 2 License for Dealing in Futures Contracts and Type 4 License for Advising on Securities.

English