
Is Chubb (CB) Pricing Reflect Its Valuation After Recent Share Price Gains?
- If you are wondering whether Chubb's current share price lines up with its underlying value, this breakdown will help you frame what you are really paying for today.
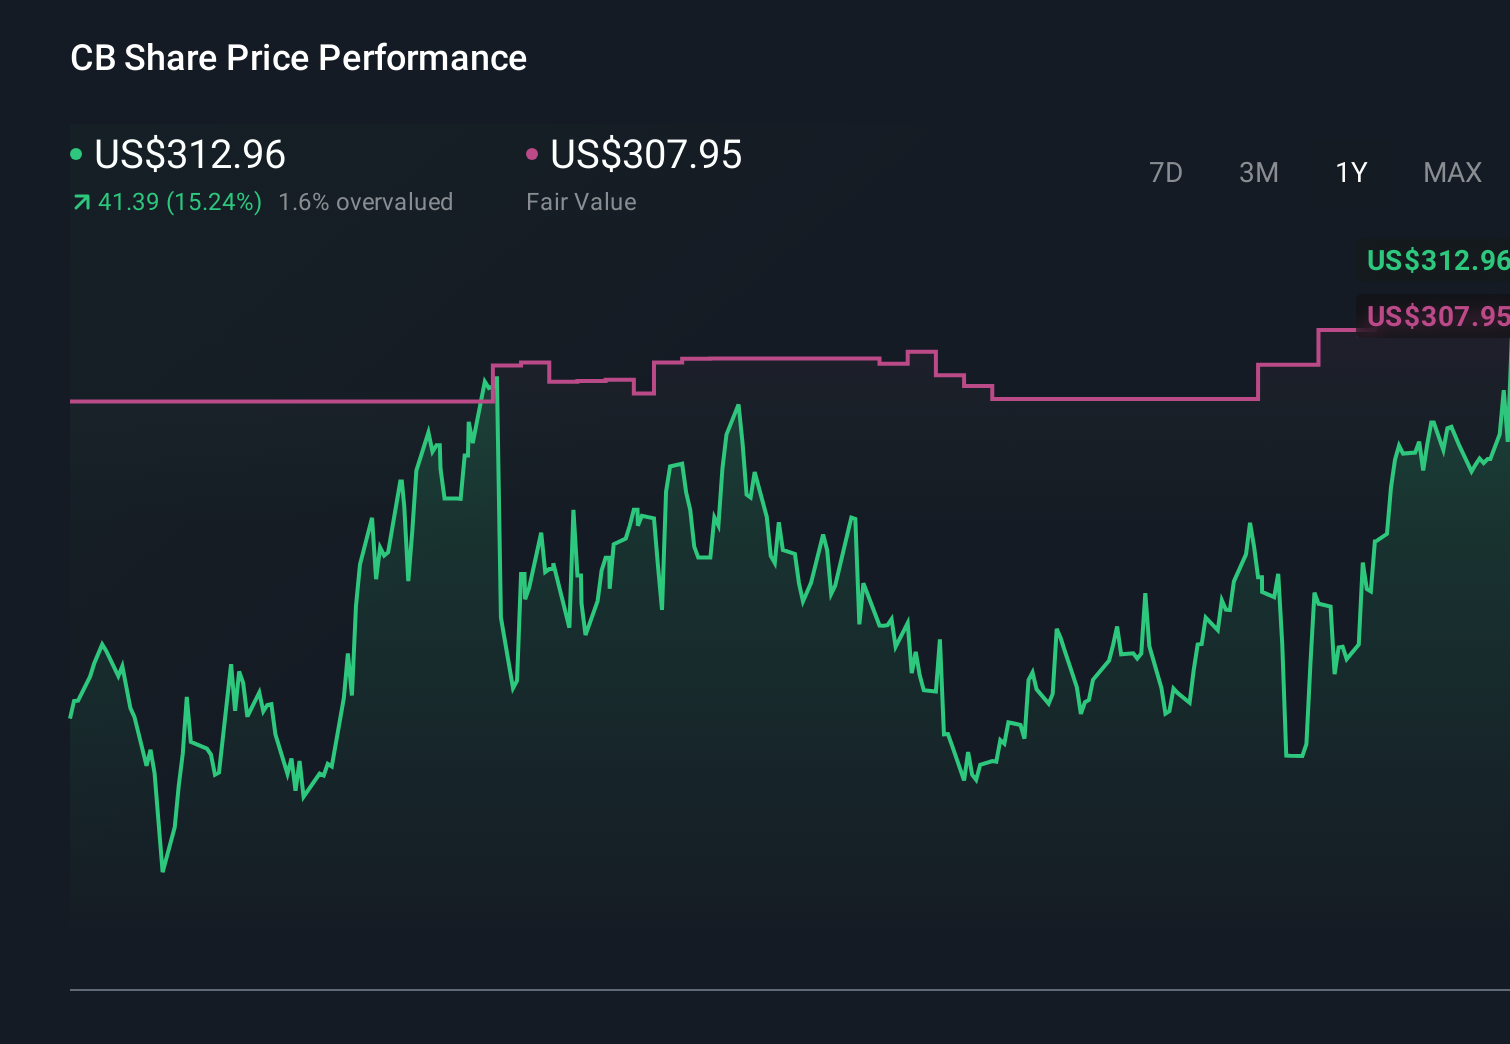
- The stock last closed at US$309.56, with returns of 2.9% over 7 days, a 0.8% decline over 30 days, a 0.2% decline year to date, 15.4% over 1 year, 54.0% over 3 years, and 105.7% over 5 years.
- Recent news coverage around Chubb has focused on its position as a major global insurer, including commentary on its underwriting discipline, balance sheet strength, and exposure across lines such as commercial and personal insurance. This context helps frame how investors might be thinking about risk, quality, and growth potential when they react to price moves.
- On our valuation checks, Chubb currently scores 4 out of 6. Next, we walk through what different valuation approaches suggest about the stock, and then finish with a more holistic way to think about value beyond any single model.
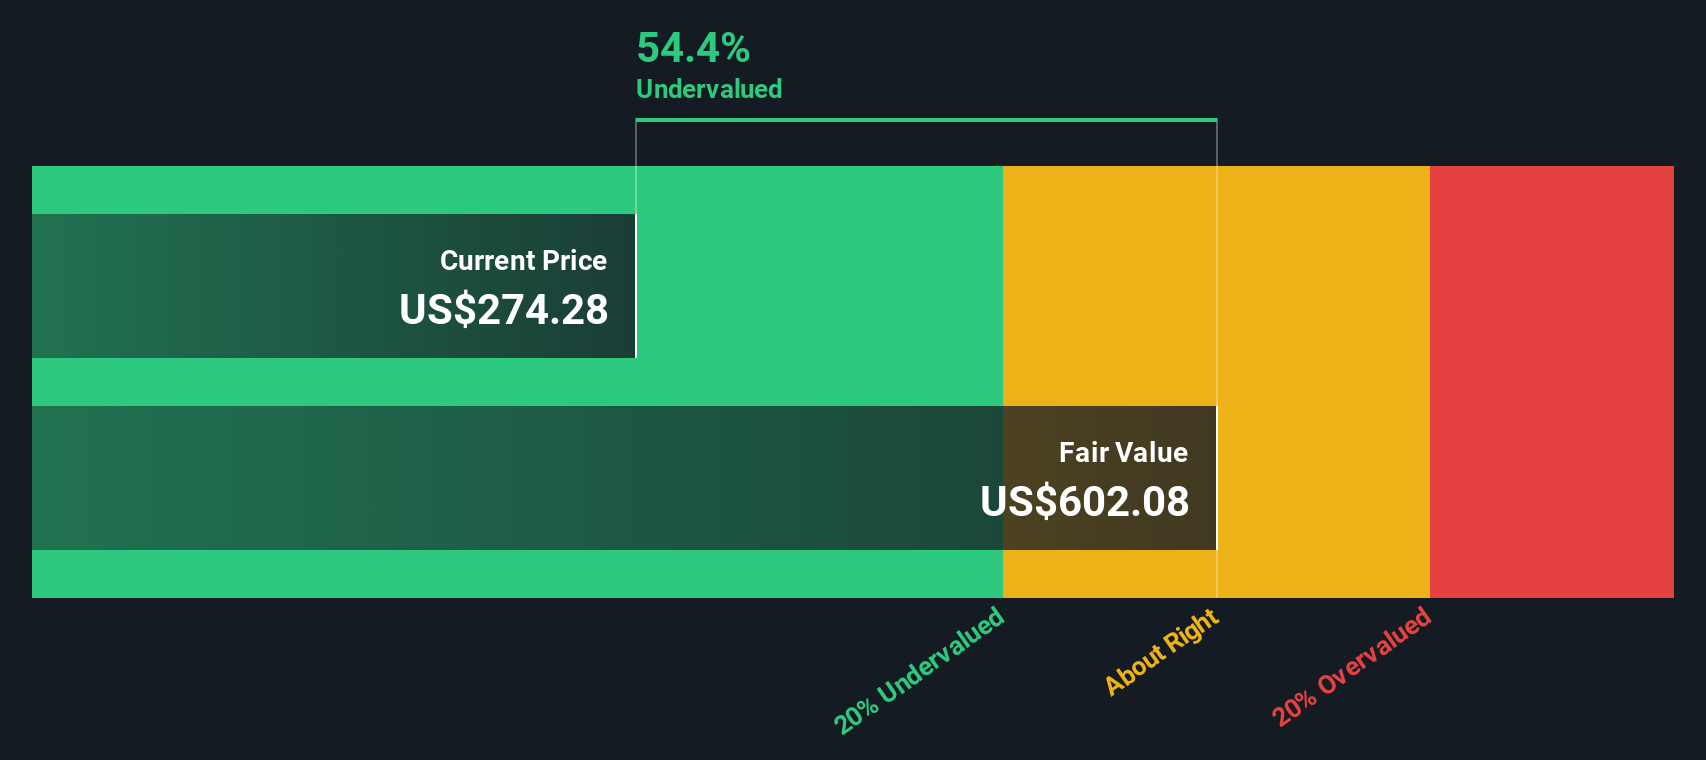
Approach 1: Chubb Excess Returns Analysis
The Excess Returns model looks at how much profit a company is expected to generate above the return that shareholders require, based on the capital invested in the business. Instead of focusing on cash flows alone, it starts from book value and earnings power to estimate what the equity is worth today.
For Chubb, the model uses a Book Value of $182.22 per share and a Stable EPS of $29.04 per share, based on weighted future Return on Equity estimates from 10 analysts. The Average Return on Equity is 13.01%, while the Cost of Equity is $14.80 per share. That leads to an estimated Excess Return of $14.24 per share, which represents the earnings attributed to shareholders above their required return.
The Stable Book Value is $223.29 per share, based on weighted future Book Value estimates from the same analyst set. Putting these inputs together, the Excess Returns model arrives at an intrinsic value estimate of $646.07 per share. Compared with the recent share price of $309.56, this implies Chubb is 52.1% undervalued on this approach.
Result: UNDERVALUED
Our Excess Returns analysis suggests Chubb is undervalued by 52.1%. Track this in your watchlist or portfolio, or discover 868 more undervalued stocks based on cash flows.
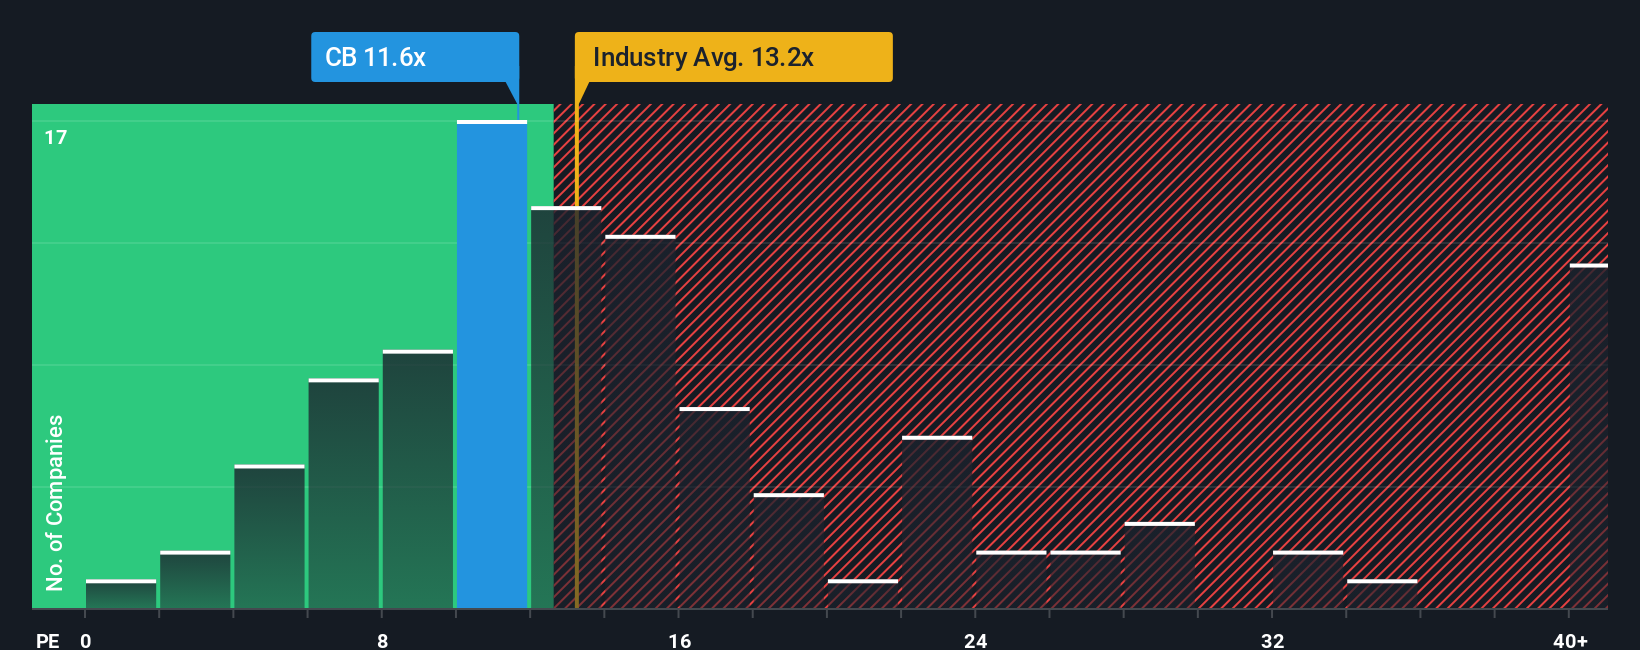
Approach 2: Chubb Price vs Earnings
P/E is a common way to value profitable companies because it links what you pay directly to the earnings the business is already generating. A higher P/E usually reflects stronger growth expectations or lower perceived risk, while a lower P/E can point to more modest growth or higher uncertainty.
Chubb currently trades on a P/E of 12.59x. That sits slightly below the Insurance industry average of 13.11x, and above the peer group average of 9.22x. On the surface, that suggests the market values Chubb more highly than many direct peers, but not especially differently from the broader industry.
Simply Wall St’s Fair Ratio for Chubb is 14.23x. This is a proprietary estimate of what a “normal” P/E might look like for the company, after accounting for factors such as earnings growth, profit margins, industry, market cap and risk. Because it blends these company specific drivers, the Fair Ratio can offer a more tailored reference point than a simple comparison to peers or the industry.
Set against the current P/E of 12.59x, the Fair Ratio of 14.23x points to Chubb trading below that modelled level.
Result: UNDERVALUED
P/E ratios tell one story, but what if the real opportunity lies elsewhere? Discover 1417 companies where insiders are betting big on explosive growth.
Upgrade Your Decision Making: Choose your Chubb Narrative
Earlier we mentioned that there is an even better way to understand valuation, so let us introduce you to Narratives, which pair the story you believe about a company with the numbers behind it, like your own fair value, revenue, earnings, and margin estimates.
A Narrative links what you think is happening at Chubb, such as its role as a major global insurer and how it uses its balance sheet and underwriting approach, to a financial forecast and then to a clear fair value that you can compare with today’s share price.
On Simply Wall St’s Community page, used by millions of investors, Narratives are presented as simple, accessible setups that help you decide if Chubb looks appealing or less appealing by comparing your Fair Value to the current Price.
Narratives also update when new information comes in, such as news or earnings, so your Chubb story and fair value view can adjust without you having to rebuild everything from scratch.
For example, one Chubb Narrative might assume a relatively optimistic fair value and margin profile, while another takes a more cautious view with lower fair value and profitability assumptions, giving you a clear sense of how different perspectives compare side by side.
Do you think there's more to the story for Chubb? Head over to our Community to see what others are saying!
This article by Simply Wall St is general in nature. We provide commentary based on historical data and analyst forecasts only using an unbiased methodology and our articles are not intended to be financial advice. It does not constitute a recommendation to buy or sell any stock, and does not take account of your objectives, or your financial situation. We aim to bring you long-term focused analysis driven by fundamental data. Note that our analysis may not factor in the latest price-sensitive company announcements or qualitative material. Simply Wall St has no position in any stocks mentioned.
Have feedback on this article? Concerned about the content? Get in touch with us directly. Alternatively, email editorial-team@simplywallst.com
Contact Us
Contact Number : +852 3852 8500Webull Securities Limited is licensed with the Securities and Futures Commission of Hong Kong (CE No. BNG700) for carrying out Type 1 License for Dealing in Securities, Type 2 License for Dealing in Futures Contracts and Type 4 License for Advising on Securities.

English