
Has The Recent Pullback In Sea (SE) Opened Up A Fresh Valuation Opportunity
- For investors considering whether Sea at around US$116 still offers value, or whether most of the opportunity is already priced in, this article focuses squarely on what you are getting for the current share price.
- The stock has seen a 6.6% decline over the last 7 days, an 11.4% decline over the last 30 days, and is also down 11.4% year to date, while the 3 year return sits at 65.3% and the 5 year return at a 54.6% decline. This naturally raises questions about how risk and potential reward now balance out.
- Recent coverage of Sea has centered on how investors are reassessing the business after these mixed return figures, with shorter term weakness contrasted against a stronger 3 year result and a weaker 5 year picture. Together, these numbers have kept attention on whether the current share price still reflects cautious sentiment or something closer to a reset.
- On our valuation checks, Sea currently scores 3 out of 6 on our value score, which you can see in full at 3 out of 6. Next, we will walk through the key valuation approaches behind that figure before finishing with a way to frame value that goes beyond the usual ratios.
Find out why Sea's -4.4% return over the last year is lagging behind its peers.
Approach 1: Sea Discounted Cash Flow (DCF) Analysis
Approach 1: Sea Discounted Cash Flow (DCF) Analysis
A Discounted Cash Flow, or DCF, model takes estimates of a company’s future cash flows and discounts them back to today using a required rate of return, giving an estimate of what the business could be worth right now.
For Sea, the model used is a 2 Stage Free Cash Flow to Equity approach. The company’s latest twelve month free cash flow stands at about $3.58b. Based on analyst inputs for the earlier years and then Simply Wall St extrapolations after that, projected free cash flow in 2030 is $8.42b, with a path of annual forecasts between 2026 and 2035 feeding into the valuation.
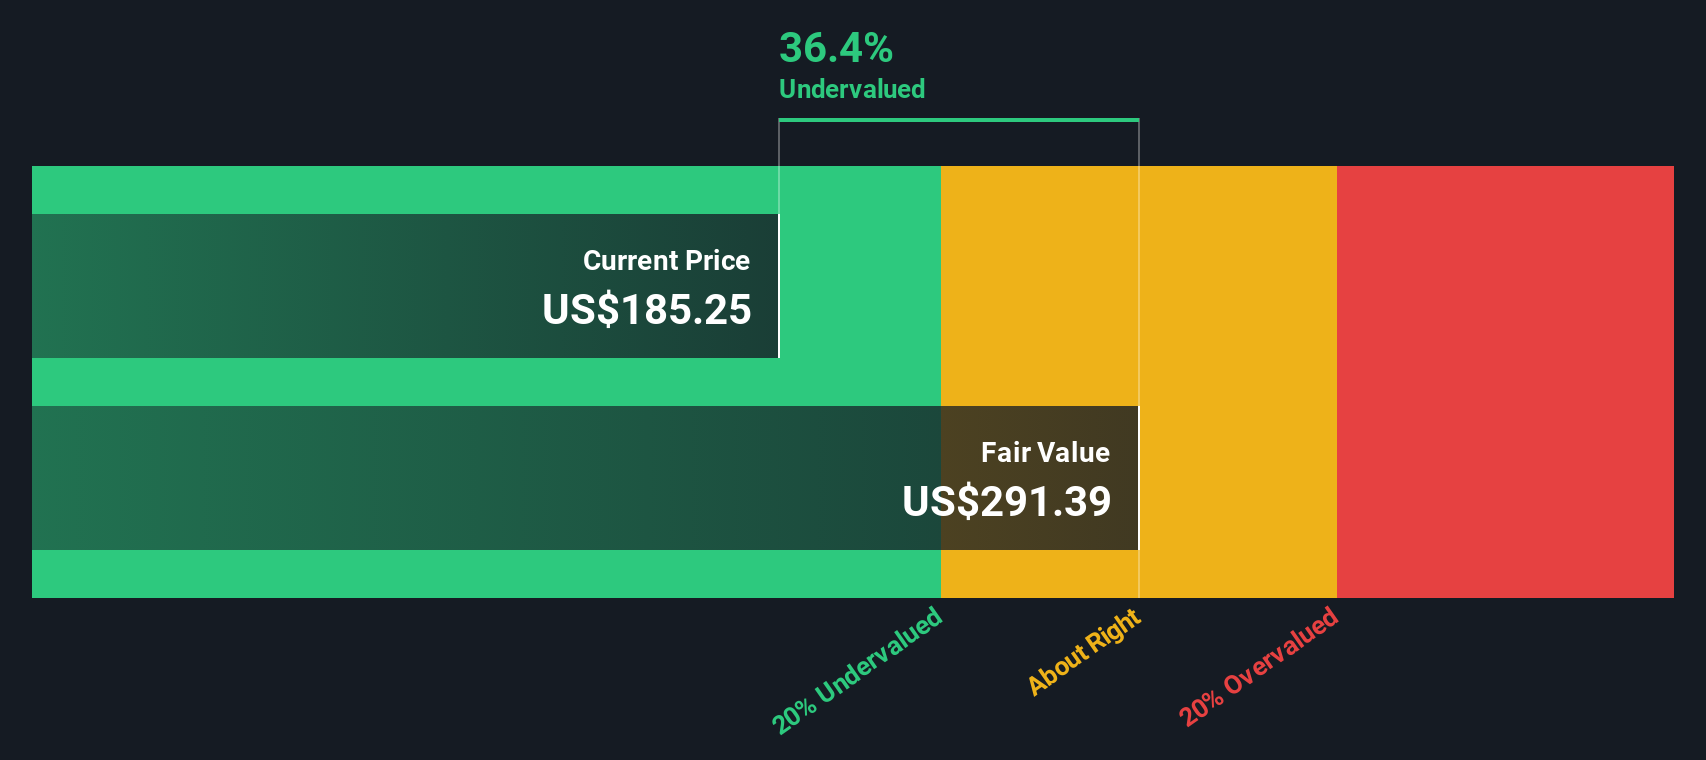
When those projected cash flows are discounted back to today and divided by the number of shares, the DCF model indicates an intrinsic value of about $275.07 per share. Relative to the current share price of around $116, this implies an intrinsic discount of roughly 57.7%, which points to the shares trading at a substantial markdown compared with this cash flow based estimate.
Result: UNDERVALUED
Our Discounted Cash Flow (DCF) analysis suggests Sea is undervalued by 57.7%. Track this in your watchlist or portfolio, or discover 875 more undervalued stocks based on cash flows.
Approach 2: Sea Price vs Earnings
For a company that is generating earnings, the P/E ratio is often a useful cross check on valuation because it links what you pay per share to the profit the business is producing today.
What counts as a normal or fair P/E ratio depends on how quickly earnings are expected to grow and how risky those earnings are. Higher growth or lower perceived risk can justify a higher multiple, while slower growth or higher risk usually points to a lower one.
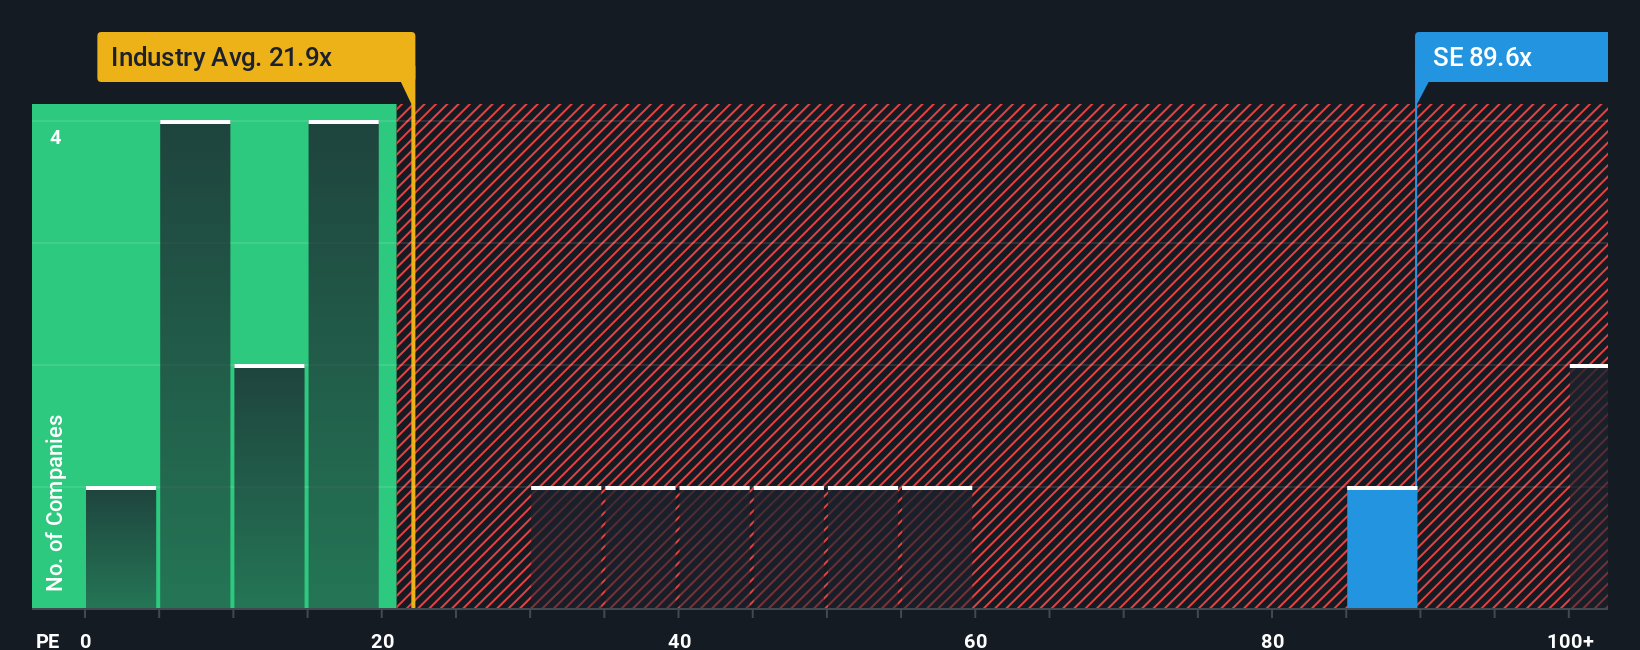
Sea currently trades on a P/E of about 48.6x. That sits above the Multiline Retail industry average of 19.8x and also above the peer group average of 43.7x. Simply Wall St’s Fair Ratio for Sea is 35.1x, which is a proprietary estimate of what the P/E could be given factors like its earnings growth profile, industry, profit margins, market cap and risk characteristics.
This Fair Ratio is more tailored than a simple peer or industry comparison because it adjusts for those company specific drivers rather than assuming all firms should trade at similar multiples. With Sea’s actual P/E at 48.6x, compared to a Fair Ratio of 35.1x, the shares currently screen as more expensive than that tailored benchmark.
Result: OVERVALUED
P/E ratios tell one story, but what if the real opportunity lies elsewhere? Discover 1426 companies where insiders are betting big on explosive growth.
Upgrade Your Decision Making: Choose your Sea Narrative
Earlier we mentioned that there is an even better way to understand valuation, so let us introduce you to Narratives, a simple way to put your story about Sea into numbers you can actually work with.
A Narrative is your view of the business written into a forecast, where you set out what you think Sea could earn in the future, what its revenues and profit margins might look like, and what that could mean for a fair value per share.
On Simply Wall St, Narratives sit inside the Community page and are used by millions of investors as an easy tool that links a company’s story to a financial forecast and then to a fair value, which you can then compare with the current share price to help decide whether it may be time to buy, hold, or sell.
Narratives update automatically when new information such as earnings or news is added, and for Sea that means one investor might build a very optimistic Narrative with higher assumed growth and margins while another uses much more cautious assumptions and arrives at a far lower fair value, all visible side by side.
Do you think there's more to the story for Sea? Head over to our Community to see what others are saying!
This article by Simply Wall St is general in nature. We provide commentary based on historical data and analyst forecasts only using an unbiased methodology and our articles are not intended to be financial advice. It does not constitute a recommendation to buy or sell any stock, and does not take account of your objectives, or your financial situation. We aim to bring you long-term focused analysis driven by fundamental data. Note that our analysis may not factor in the latest price-sensitive company announcements or qualitative material. Simply Wall St has no position in any stocks mentioned.
Have feedback on this article? Concerned about the content? Get in touch with us directly. Alternatively, email editorial-team@simplywallst.com
Contact Us
Contact Number : +852 3852 8500Webull Securities Limited is licensed with the Securities and Futures Commission of Hong Kong (CE No. BNG700) for carrying out Type 1 License for Dealing in Securities, Type 2 License for Dealing in Futures Contracts and Type 4 License for Advising on Securities.

English