
Is Sonos (SONO) Pricing Too Rich After Mixed Long Term Share Performance
- If you are looking at Sonos and wondering whether the current share price gives you good value, you are not alone. This article will walk through what that price really reflects.
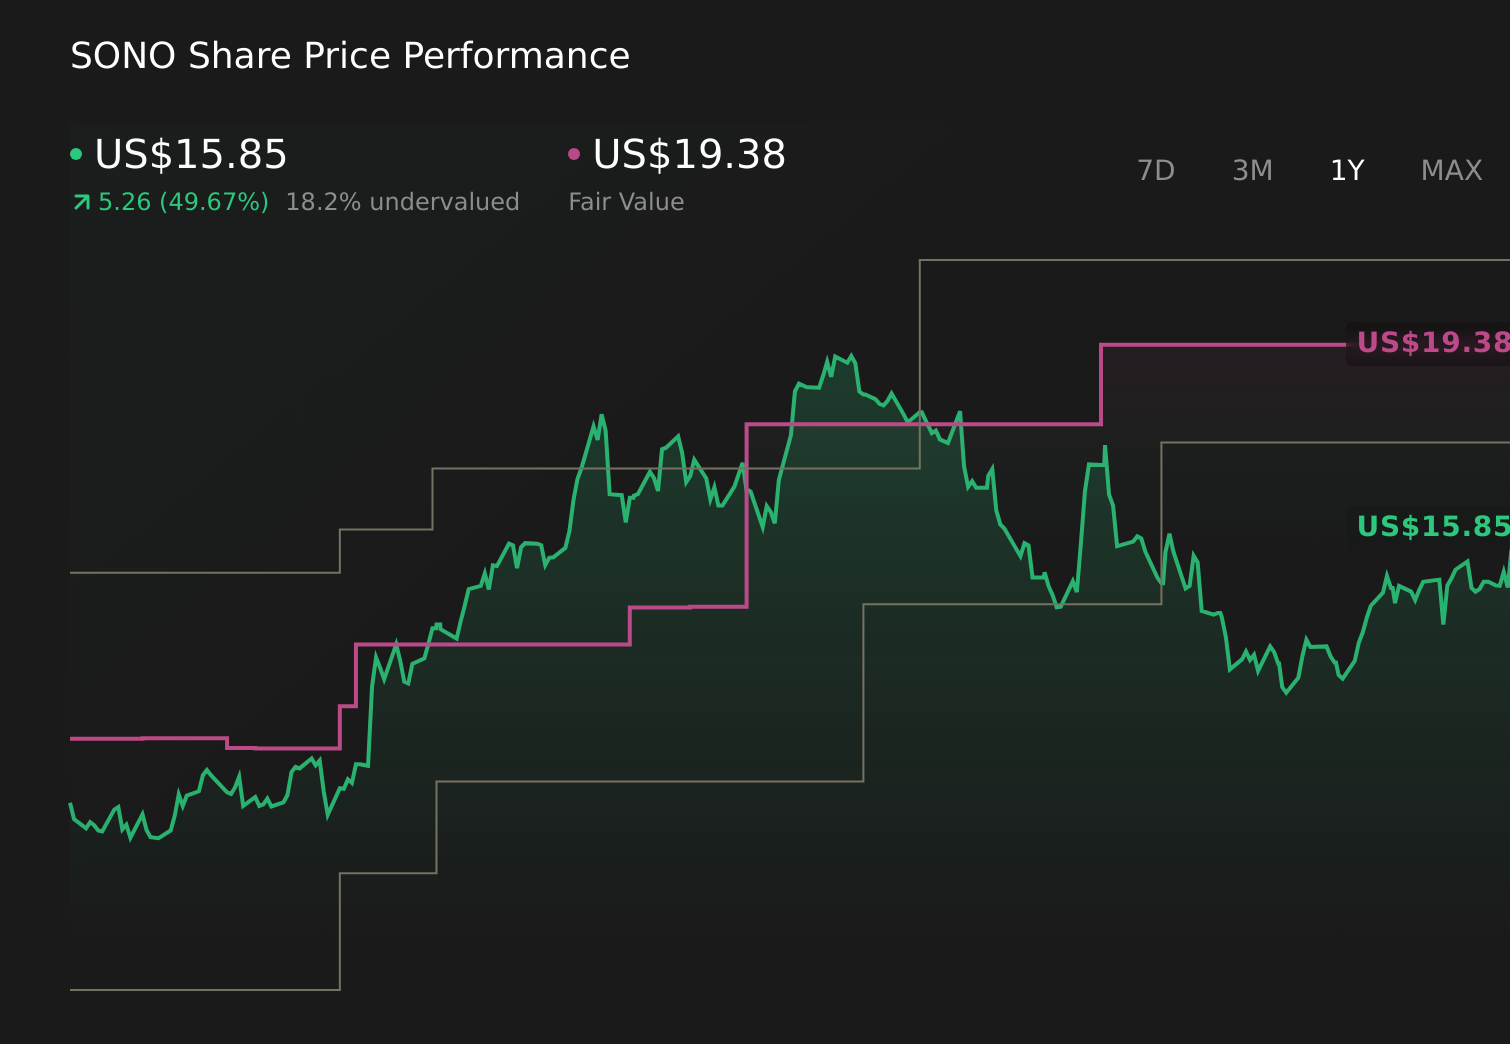
- Sonos shares last closed at US$14.35, with returns of a 3.8% decline over 7 days, an 18.0% decline over 30 days, an 18.0% decline year to date, a 4.1% gain over 1 year, a 24.1% decline over 3 years, and a 53.7% decline over 5 years.
- These mixed returns have put a spotlight on what might be driving the share price, and whether the recent pullback is justified by fundamentals or sentiment. Recent news coverage has focused on Sonos as an established consumer audio brand, which helps frame how investors are thinking about its long term prospects and the price they are prepared to pay today.
- On our checks, Sonos scores 1 out of 6 on undervaluation tests, giving it a valuation score of 1. We will walk through standard methods like P/E, cash flow based metrics and peer comparisons, then finish with a broader framework that can help you judge the valuation story for yourself.
Sonos scores just 1/6 on our valuation checks. See what other red flags we found in the full valuation breakdown.
Approach 1: Sonos Discounted Cash Flow (DCF) Analysis
A Discounted Cash Flow, or DCF, model estimates what a company might be worth by projecting its future cash flows and then discounting those back to today. It is essentially asking what those future dollars are worth in present terms.
For Sonos, the model uses a 2 Stage Free Cash Flow to Equity approach based on cash flow projections. The company last reported free cash flow of about US$94.8 million, with Simply Wall St using analyst and extrapolated estimates for future years. For example, free cash flow is projected at US$117.4 million in 2025 and then in a range of roughly US$69.7 million to US$46.6 million a year across the 2026 to 2035 period, all in US dollars and discounted back to today.
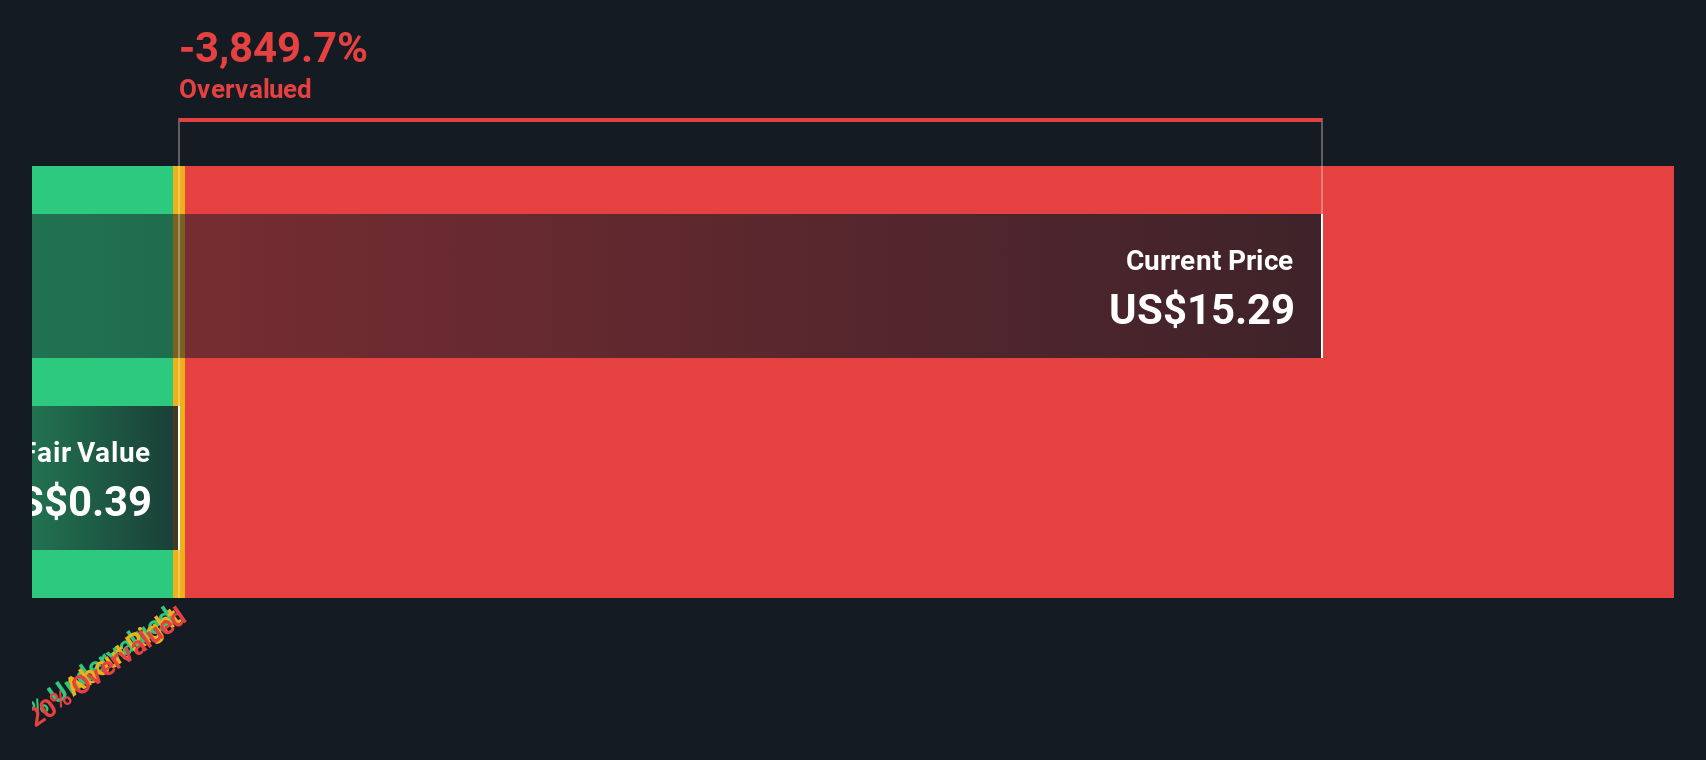
When those projected cash flows are added up and adjusted, the DCF model arrives at an estimated intrinsic value of about US$6.17 per share. Compared with the recent share price of US$14.35, this suggests Sonos is assessed as 132.4% overvalued using this method.
Result: OVERVALUED
Our Discounted Cash Flow (DCF) analysis suggests Sonos may be overvalued by 132.4%. Discover 875 undervalued stocks or create your own screener to find better value opportunities.
Approach 2: Sonos Price vs Sales
For a company like Sonos, where investors are often focused on revenue rather than current earnings, the P/S ratio can be a useful way to think about what you are paying for each dollar of sales.
What counts as a “normal” or “fair” P/S ratio usually reflects expectations for future growth and the perceived risk of the business. Higher expected growth or lower perceived risk can justify a higher multiple, while slower growth or higher risk tends to support a lower one.
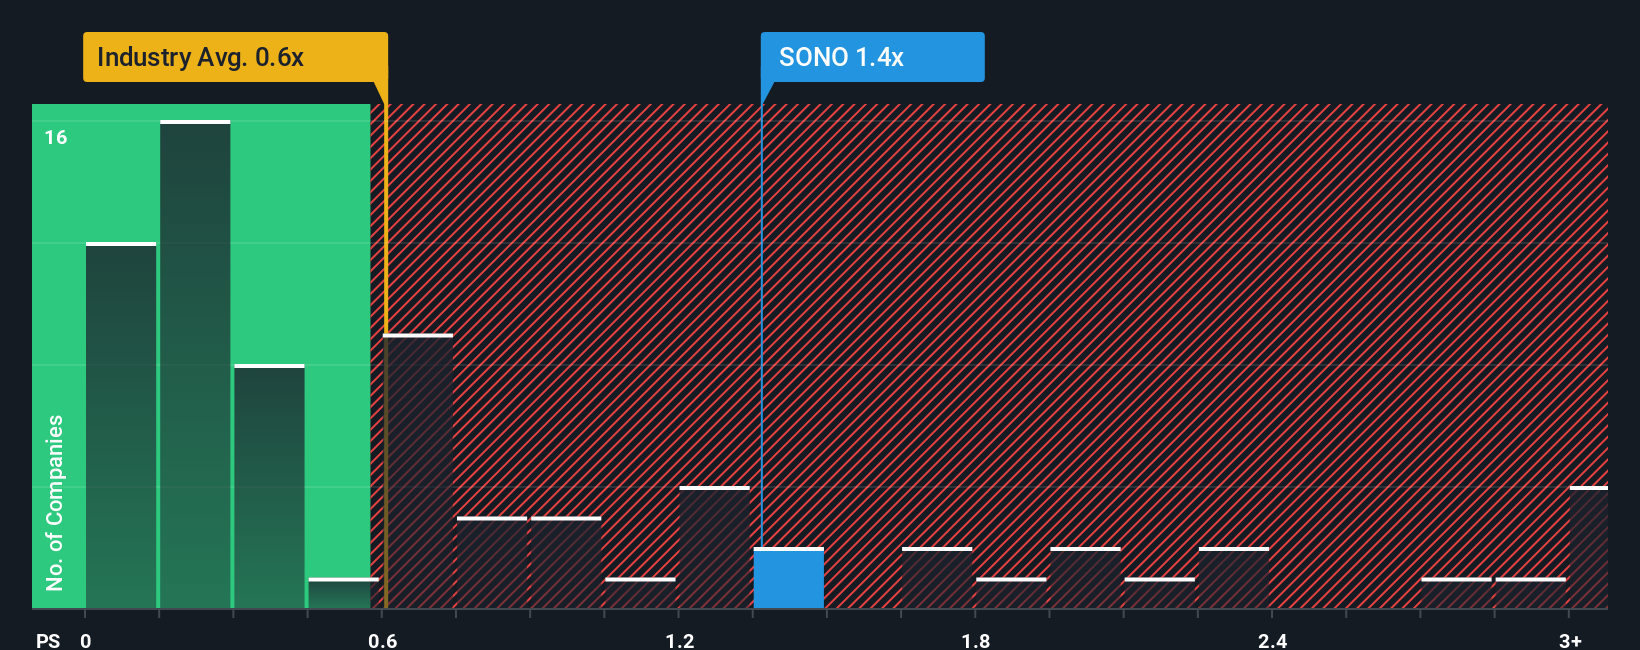
Sonos currently trades on a P/S ratio of 1.20x. That sits above the Consumer Durables industry average of 0.61x, but below the peer average of 1.56x. Simply Wall St also uses a proprietary “Fair Ratio” of 0.94x, which is the P/S multiple it would expect for Sonos after weighing factors such as earnings growth, profit margin, industry, market cap and company specific risks.
This Fair Ratio can be more informative than a straight comparison with peers or the industry because it attempts to tailor the multiple to Sonos’ own profile rather than applying a broad group average.
Comparing the current 1.20x P/S with the 0.94x Fair Ratio points to Sonos looking overvalued on this metric.
Result: OVERVALUED
P/S ratios tell one story, but what if the real opportunity lies elsewhere? Discover 1426 companies where insiders are betting big on explosive growth.
Upgrade Your Decision Making: Choose your Sonos Narrative
Earlier we mentioned that there is an even better way to understand valuation. Let us introduce you to Narratives, which are simply your story about Sonos linked directly to the numbers you think are reasonable for its future revenue, earnings and margins.
Instead of only relying on DCFs or multiples, a Narrative lets you spell out how you think Sonos’ business could play out, translate that into a financial forecast, and then connect that forecast to a fair value estimate.
On Simply Wall St, Narratives sit inside the Community page, where millions of investors can easily create or review these story plus forecast plus fair value combinations without needing complex models.
Once you have a Narrative, you can compare your fair value with the current Sonos share price and use that gap to help decide whether you feel more comfortable buying, holding or selling.
Because Narratives update automatically when new information such as news or earnings is added to the platform, your view on Sonos can stay aligned with the latest data without you rebuilding the whole model.
For example, one Sonos Narrative on the platform might set a very conservative fair value, while another assumes a much higher figure based on different revenue or margin expectations. This shows how the same company can support very different but clearly expressed views.
Do you think there's more to the story for Sonos? Head over to our Community to see what others are saying!
This article by Simply Wall St is general in nature. We provide commentary based on historical data and analyst forecasts only using an unbiased methodology and our articles are not intended to be financial advice. It does not constitute a recommendation to buy or sell any stock, and does not take account of your objectives, or your financial situation. We aim to bring you long-term focused analysis driven by fundamental data. Note that our analysis may not factor in the latest price-sensitive company announcements or qualitative material. Simply Wall St has no position in any stocks mentioned.
Have feedback on this article? Concerned about the content? Get in touch with us directly. Alternatively, email editorial-team@simplywallst.com
Contact Us
Contact Number : +852 3852 8500Webull Securities Limited is licensed with the Securities and Futures Commission of Hong Kong (CE No. BNG700) for carrying out Type 1 License for Dealing in Securities, Type 2 License for Dealing in Futures Contracts and Type 4 License for Advising on Securities.

English