
Ralliant (RAL) Valuation Check After Recent Share Price Momentum And Mixed Short Term Trading
Ralliant stock reacts to recent trading performance
Ralliant (RAL) has seen mixed short term trading, with the share price down about 1.6% over the past day and 1.4% over the past week, but up over the past month and past 3 months.
See our latest analysis for Ralliant.
With the share price now at $52.97, Ralliant’s 90 day share price return of 19.63% versus a 3.42% year to date share price return suggests momentum has been building recently. This can reflect shifting expectations for the company’s growth or risk profile.
If Ralliant’s move has you looking around the sector, this could be a good moment to scan high growth tech and AI stocks for other tech names showing interesting price trends and fundamentals.
With Ralliant trading at $52.97, a value score of 2, a small 8.29% gap to the average analyst price target, and an intrinsic value estimate that is 4.84% above the market, you have to ask: is there still a buying opportunity here, or is the market already pricing in future growth?
Price-to-Earnings of 25.5x: Is it justified?
On a P/E of 25.5x at a share price of $52.97, Ralliant sits slightly below both its Electronic industry average and its closest peer group, even though our estimate of future cash flow value is $50.52. That mix of signals gives you a valuation that is not clearly stretched, but not obviously cheap either.
The P/E ratio compares the current share price to earnings per share and is a quick way to see how much investors are paying for each dollar of profit. For a company like Ralliant that supplies test and measurement instruments, sensors, and safety systems to industrial and electronics end markets, earnings based measures are often a common reference point because profit quality matters alongside growth expectations.
Here, Ralliant screens as good value versus the US Electronic industry. Its 25.5x P/E sits below the 26.6x industry average and well below a 47.6x peer average. At the same time, the P/E is above an estimated fair P/E of 23.2x. This suggests the market has pushed the multiple a bit higher than the level our fair ratio work points to as a potential anchor over time.
Explore the SWS fair ratio for Ralliant
Result: Price-to-Earnings of 25.5x (ABOUT RIGHT)
However, you still have to weigh risks such as exposure to cyclical industrial and electronics demand, as well as potential pressure on margins if end markets or large customers pull back.
Find out about the key risks to this Ralliant narrative.
Another view on Ralliant’s value
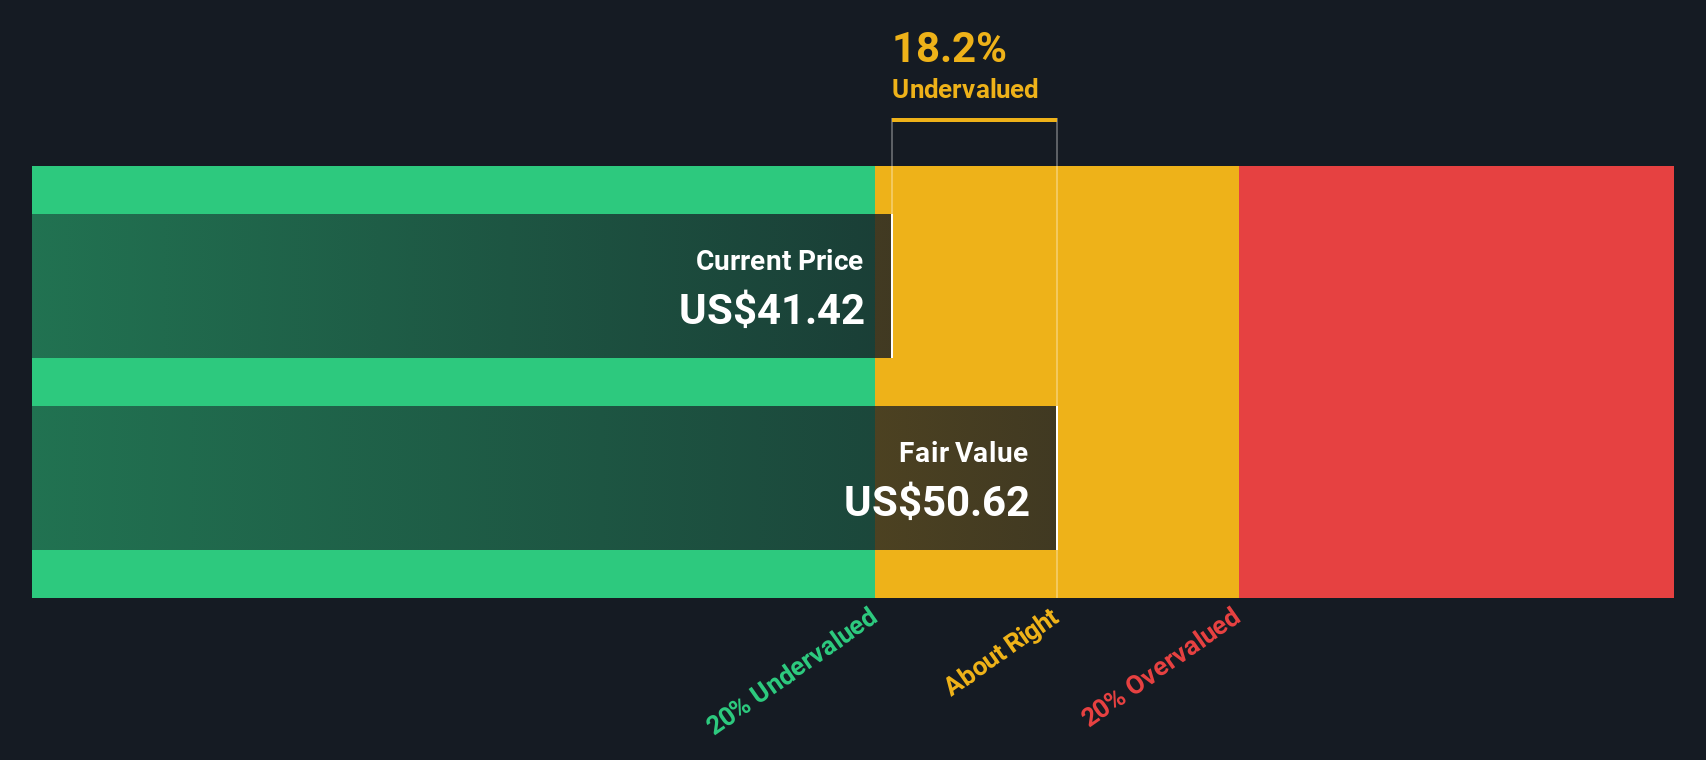
The P/E story suggests Ralliant is roughly fairly priced, but our DCF model points in a different direction. At $52.97, the shares sit above an estimated future cash flow value of $50.52, which signals a degree of downside risk if cash generation does not meet expectations.
Look into how the SWS DCF model arrives at its fair value.
Simply Wall St performs a discounted cash flow (DCF) on every stock in the world every day (check out Ralliant for example). We show the entire calculation in full. You can track the result in your watchlist or portfolio and be alerted when this changes, or use our stock screener to discover 877 undervalued stocks based on their cash flows. If you save a screener we even alert you when new companies match - so you never miss a potential opportunity.
Build Your Own Ralliant Narrative
If you look at the numbers and reach a different conclusion, or just prefer to test your own assumptions, you can build a complete view in minutes with Do it your way.
A great starting point for your Ralliant research is our analysis highlighting 2 key rewards and 1 important warning sign that could impact your investment decision.
Looking for more investment ideas?
If Ralliant has your attention, do not stop here. Use the Simply Wall St Screener to uncover more ideas that fit your style before others spot them.
- Target higher income potential by checking out these 12 dividend stocks with yields > 3% that already meet a yield threshold above 3% with supporting fundamentals.
- Ride the AI trend with focus by scanning these 24 AI penny stocks that tie artificial intelligence themes to real business models and financials.
- Get ahead of emerging trends by reviewing these 18 cryptocurrency and blockchain stocks linked to cryptocurrency infrastructure, blockchain services, and digital asset ecosystems.
This article by Simply Wall St is general in nature. We provide commentary based on historical data and analyst forecasts only using an unbiased methodology and our articles are not intended to be financial advice. It does not constitute a recommendation to buy or sell any stock, and does not take account of your objectives, or your financial situation. We aim to bring you long-term focused analysis driven by fundamental data. Note that our analysis may not factor in the latest price-sensitive company announcements or qualitative material. Simply Wall St has no position in any stocks mentioned.
Have feedback on this article? Concerned about the content? Get in touch with us directly. Alternatively, email editorial-team@simplywallst.com
Contact Us
Contact Number : +852 3852 8500Webull Securities Limited is licensed with the Securities and Futures Commission of Hong Kong (CE No. BNG700) for carrying out Type 1 License for Dealing in Securities, Type 2 License for Dealing in Futures Contracts and Type 4 License for Advising on Securities.

English