
Is GameStop (GME) Pricing Match Recent Volatility And DCF Value Gap
- If you are wondering whether GameStop's current share price lines up with its underlying value, you are not alone. This article is designed to walk you through that question step by step.
- Over shorter time frames the stock has been volatile, with returns of 7.7% over the last week, 25.4% over the last month and year to date, while the 1 year and 5 year returns sit at 1.0% and 74.4% respectively.
- Recent headlines around GameStop have continued to focus on its role as a high profile retail trading story and the ongoing debate about how closely its share price tracks the fundamentals of its underlying retail business. This backdrop helps explain why price moves can be sharp, as sentiment can shift quickly when new commentary, analyst views or trading activity emerge.
- Our valuation checks give GameStop a 2 out of 6 valuation score. This raises the question of how different methods such as discounted cash flow, multiples and other tools assess its price, and we will also look at an even more practical way to think about valuation at the end of this article.
GameStop scores just 2/6 on our valuation checks. See what other red flags we found in the full valuation breakdown.
Approach 1: GameStop Discounted Cash Flow (DCF) Analysis
A Discounted Cash Flow, or DCF, model estimates what a company might be worth by projecting its future cash flows and then discounting those back to today’s value.
For GameStop, the model starts with last twelve months Free Cash Flow of about $563.2 million. Simply Wall St then applies a 2 Stage Free Cash Flow to Equity approach, using analyst estimates where available and extrapolating further years to build a ten year cash flow profile.
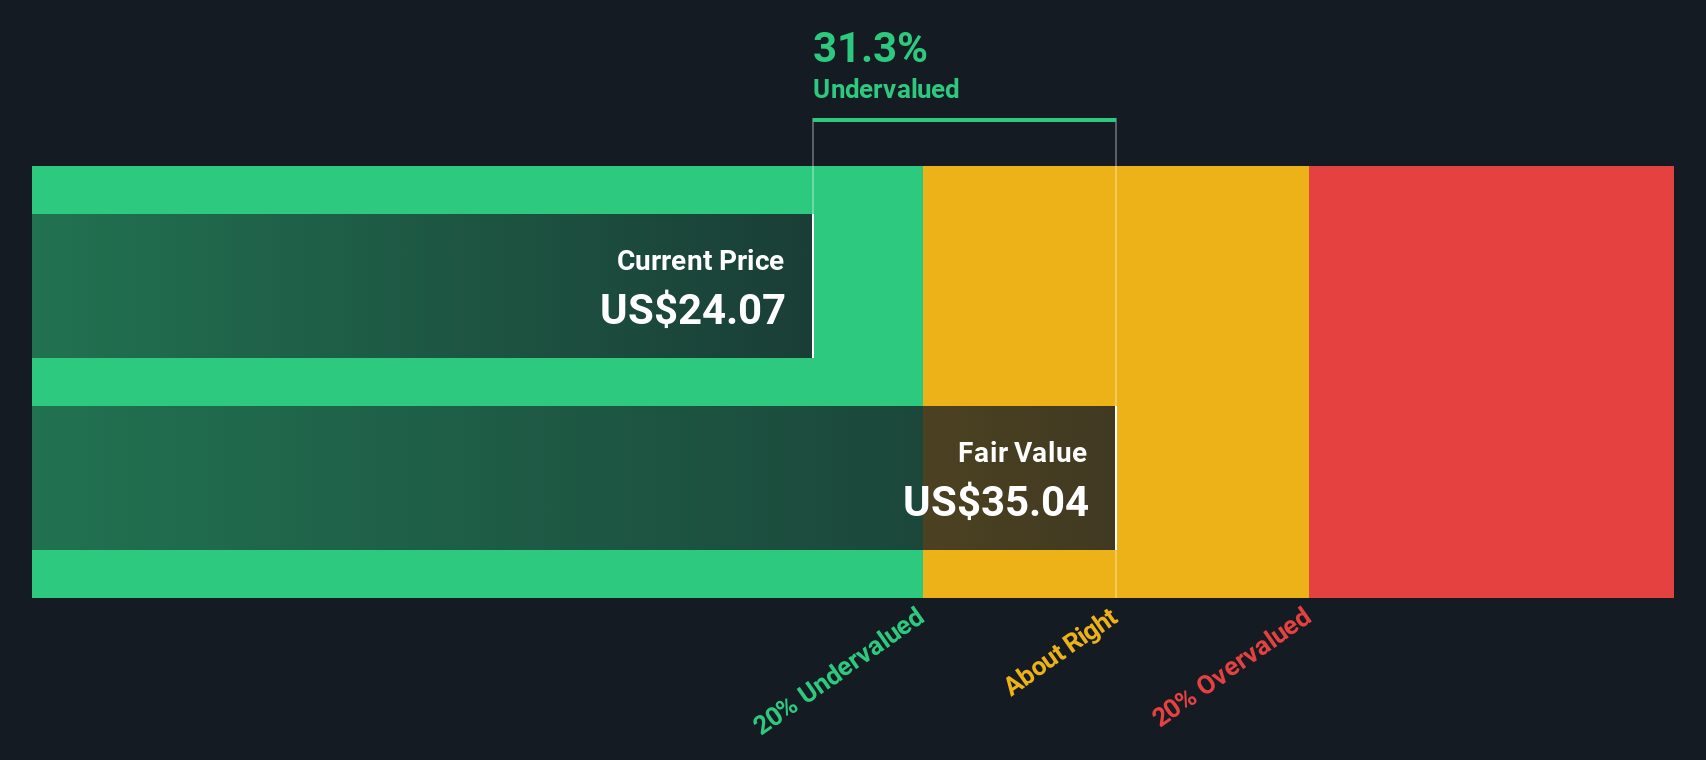
Those projections run from an estimated $950.5 million in 2026 up to an estimated $4.5 billion in 2035, with each year’s cash flow discounted back to today. Adding these, plus an estimate of value beyond year ten, gives an intrinsic value per share of $104.57.
Compared with the current share price, the DCF implies the stock trades at a 75.3% discount to this intrinsic value, which points to a wide gap between the model’s estimate and the market price.
Result: UNDERVALUED
Our Discounted Cash Flow (DCF) analysis suggests GameStop is undervalued by 75.3%. Track this in your watchlist or portfolio, or discover 877 more undervalued stocks based on cash flows.
Approach 2: GameStop Price vs Earnings
For profitable companies, the P/E ratio is a useful way to relate what you pay for a share to the earnings that company is currently generating. It gives you a quick sense of how many years of current earnings the market is pricing in.
What counts as a “normal” P/E depends a lot on how fast earnings are expected to grow and how risky those earnings are. Higher expected growth or lower perceived risk can justify a higher P/E, while slower growth or higher uncertainty tend to line up with a lower P/E.
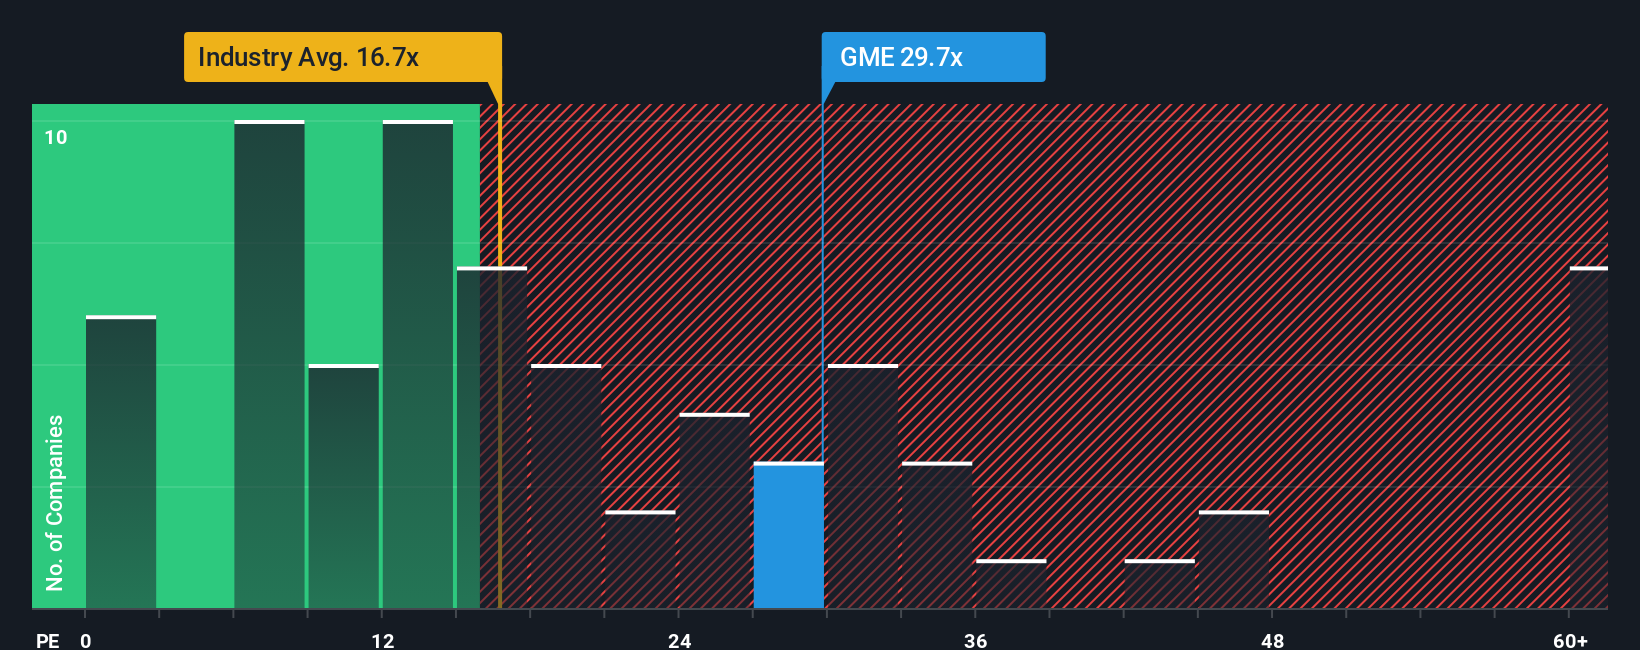
GameStop is currently trading on a P/E of 27.45x. That sits above the Specialty Retail industry average of 20.37x and also above the peer group average of 20.66x. This indicates that the market is putting a richer tag on its earnings than it is on many similar businesses.
Simply Wall St’s Fair Ratio is a proprietary estimate of what P/E might make sense for GameStop given its earnings profile, industry, profit margins, market cap and risk factors. Rather than only comparing to broad industry or peer averages, Fair Ratio adjusts for company specific traits that can justify a higher or lower multiple.
In GameStop’s case, the Fair Ratio is not available, so there is no clear model based signal on whether the current 27.45x P/E looks high, low or in line with those fundamentals.
Result: ABOUT RIGHT
P/E ratios tell one story, but what if the real opportunity lies elsewhere? Discover 1425 companies where insiders are betting big on explosive growth.
Upgrade Your Decision Making: Choose your GameStop Narrative
Earlier we mentioned that there is an even better way to understand valuation, so let us introduce Narratives. A Narrative is simply your story for a company, where you set your own view of fair value and your expectations for future revenue, earnings and margins, instead of only relying on a single model or market view. On Simply Wall St, within the Community page used by millions of investors, Narratives link that story to a full forecast and then to a fair value estimate that you can compare directly with the current share price to help you decide whether GameStop looks appealing or less appealing on your terms. Narratives update automatically when fresh news, earnings or other information is available, so your story and fair value stay aligned with what is happening. For GameStop, one investor might build a Narrative that points to a very optimistic fair value, while another might create a far more cautious Narrative with a much lower fair value, and both can see in real time how their story compares with the current price.
Do you think there's more to the story for GameStop? Head over to our Community to see what others are saying!

This article by Simply Wall St is general in nature. We provide commentary based on historical data and analyst forecasts only using an unbiased methodology and our articles are not intended to be financial advice. It does not constitute a recommendation to buy or sell any stock, and does not take account of your objectives, or your financial situation. We aim to bring you long-term focused analysis driven by fundamental data. Note that our analysis may not factor in the latest price-sensitive company announcements or qualitative material. Simply Wall St has no position in any stocks mentioned.
Have feedback on this article? Concerned about the content? Get in touch with us directly. Alternatively, email editorial-team@simplywallst.com
Contact Us
Contact Number : +852 3852 8500Webull Securities Limited is licensed with the Securities and Futures Commission of Hong Kong (CE No. BNG700) for carrying out Type 1 License for Dealing in Securities, Type 2 License for Dealing in Futures Contracts and Type 4 License for Advising on Securities.

English