
Assessing OSI Systems (OSIS) Valuation After Earnings Beat, Major European Contract Win And Ongoing Buybacks
OSI Systems (OSIS) just reported quarterly and six month results alongside an update on its buyback and a new security contract tied to a major European sporting event, giving investors several fresh data points to assess.
See our latest analysis for OSI Systems.
Despite the recent earnings beat, new European security contract and ongoing buybacks, OSI Systems’ recent 30 day share price return of 6.74% and 90 day share price return of 10.33% show some cooling after a strong run. At the same time, the 1 year total shareholder return of 24.07% and 3 year total shareholder return of 172.53% underline how powerful the longer term trend has been.
If this mix of contracts and capital returns has your attention, it could be a good moment to see what else is moving across aerospace and defense stocks.
With earnings, a fresh European security contract, active buybacks and analyst targets above the current US$253.10 share price, the key question now is simple: is OSI Systems still undervalued, or is the market already pricing in future growth?
Most Popular Narrative: 14.2% Undervalued
With OSI Systems last closing at $253.10 against a narrative fair value of $295.00, the current share price sits below what that work suggests, raising the question of how those numbers are built.
Record backlog levels, global customer diversification beyond large legacy contracts like Mexico, and increased investment in R&D for differentiated platforms position OSI to accelerate earnings and free cash flow growth, and to better capitalize on long-term secular trends underpinning security and diagnostic infrastructure spending.
Curious what earnings path and margin profile sit behind that fair value, and what kind of future P/E multiple the narrative leans on, without seeing every assumption upfront.
Result: Fair Value of $295 (UNDERVALUED)
Have a read of the narrative in full and understand what's behind the forecasts.
However, the heavy dependence on government and border security contracts, along with ongoing weakness in the healthcare division, could quickly challenge the earnings and valuation story investors are watching.
Find out about the key risks to this OSI Systems narrative.
Another View: Cash Flows Tell A Different Story
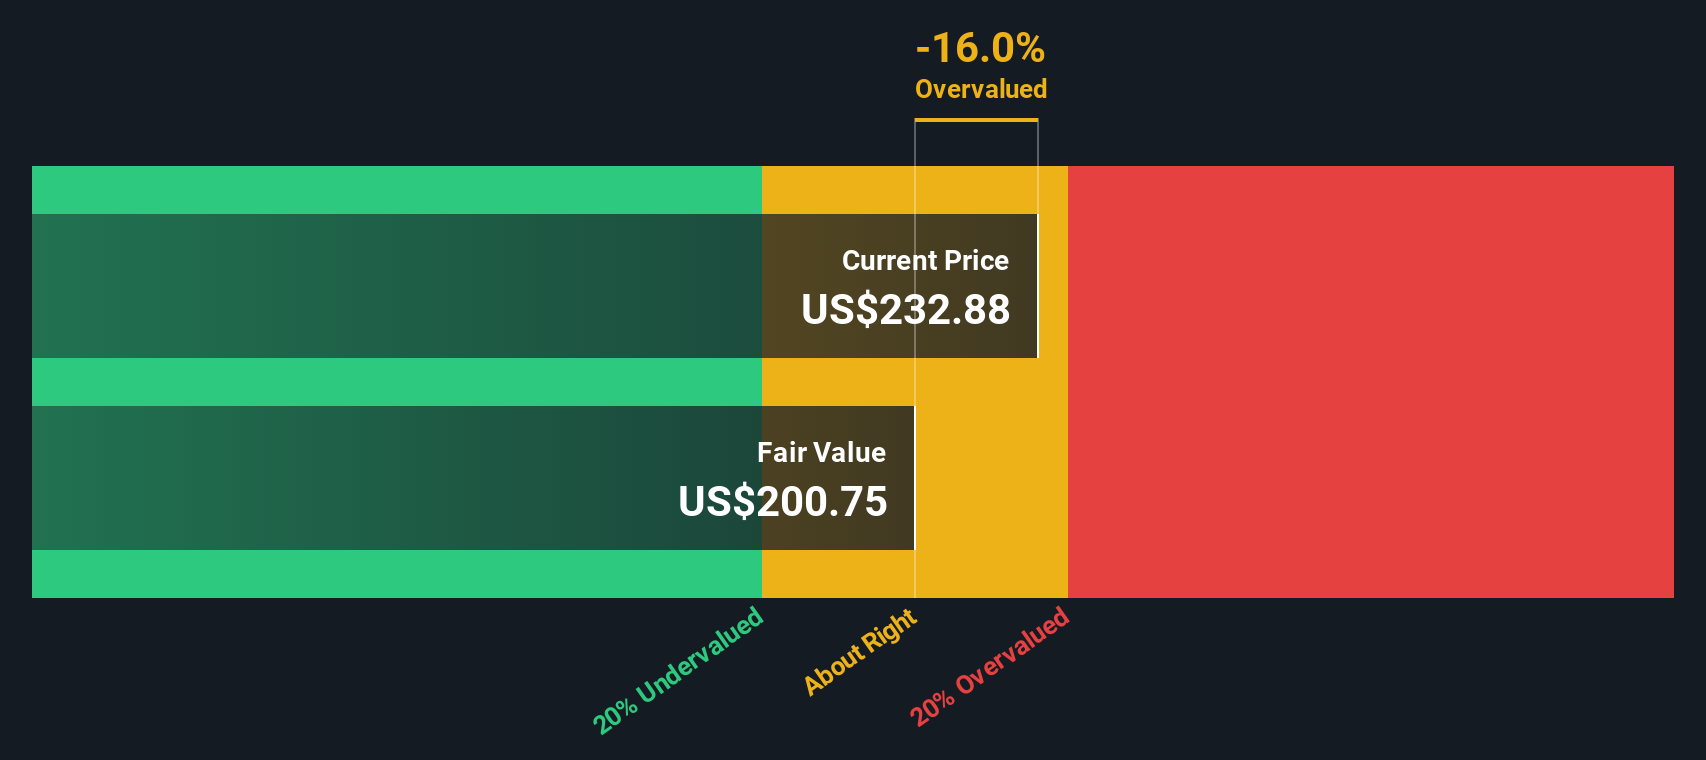
While the narrative fair value suggests OSI Systems looks 14.2% undervalued at $295 per share, our DCF model points in the opposite direction, with a future cash flow value of $195.90. On that basis, the current $253.10 price screens as overvalued. The question for investors is which signal they consider more informative: earnings power or cash generation.
Look into how the SWS DCF model arrives at its fair value.
Simply Wall St performs a discounted cash flow (DCF) on every stock in the world every day (check out OSI Systems for example). We show the entire calculation in full. You can track the result in your watchlist or portfolio and be alerted when this changes, or use our stock screener to discover 868 undervalued stocks based on their cash flows. If you save a screener we even alert you when new companies match - so you never miss a potential opportunity.
Build Your Own OSI Systems Narrative
If you are not fully on board with these conclusions or prefer to roll up your sleeves and work through the numbers yourself, you can build a tailored view in just a few minutes with Do it your way.
A great starting point for your OSI Systems research is our analysis highlighting 3 key rewards and 2 important warning signs that could impact your investment decision.
Ready for more investment ideas?
If OSI Systems has sharpened your thinking, do not stop here. Use the Simply Wall St Screener to spot other opportunities that could suit your approach.
- Target higher income potential by scanning these 11 dividend stocks with yields > 3% that may appeal if you care about regular cash returns.
- Hunt for long term growth angles through these 27 AI penny stocks that are tapping into advances in artificial intelligence.
- Spot possible mispriced opportunities with these 868 undervalued stocks based on cash flows that might trade below what their cash flows suggest.
This article by Simply Wall St is general in nature. We provide commentary based on historical data and analyst forecasts only using an unbiased methodology and our articles are not intended to be financial advice. It does not constitute a recommendation to buy or sell any stock, and does not take account of your objectives, or your financial situation. We aim to bring you long-term focused analysis driven by fundamental data. Note that our analysis may not factor in the latest price-sensitive company announcements or qualitative material. Simply Wall St has no position in any stocks mentioned.
Have feedback on this article? Concerned about the content? Get in touch with us directly. Alternatively, email editorial-team@simplywallst.com
Contact Us
Contact Number :+852 3852 8500Webull Securities Limited is licensed with the Securities and Futures Commission of Hong Kong (CE No. BNG700) for carrying out Type 1 License for Dealing in Securities, Type 2 License for Dealing in Futures Contracts and Type 4 License for Advising on Securities.

English