
Is It Too Late To Reassess Semiconductor Manufacturing International (SEHK:981) After Its 1-Year Rally?
- If you are wondering whether Semiconductor Manufacturing International is attractively priced or looking stretched at current levels, you are not alone. That is exactly what this article is here to unpack.
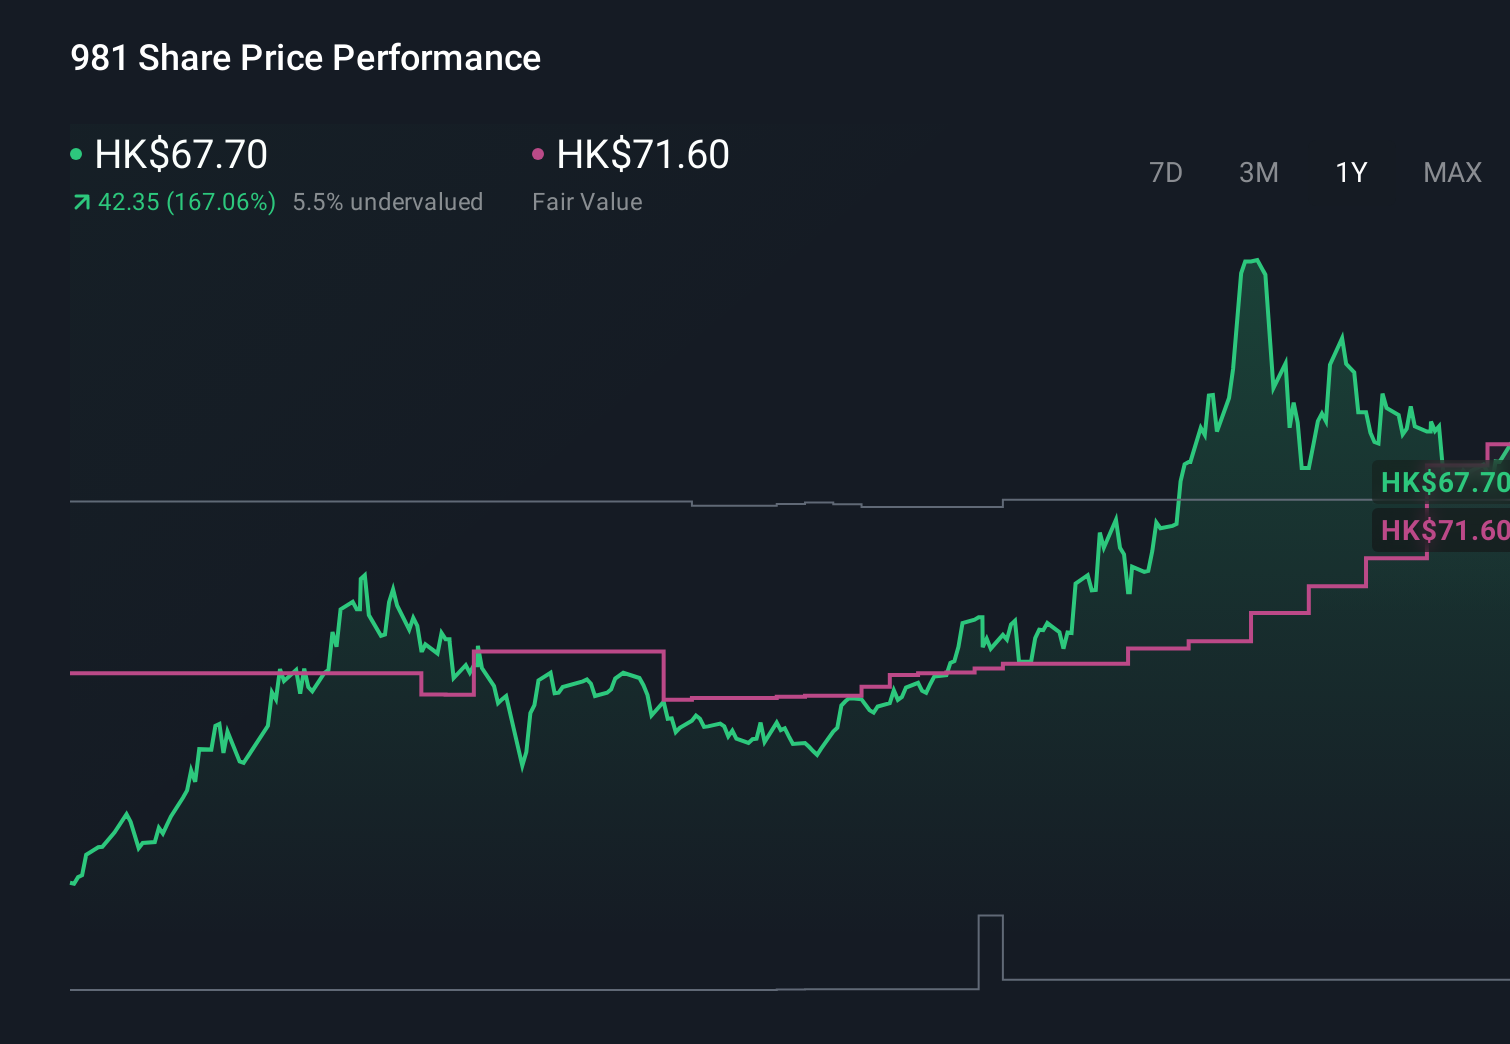
- The share price closed at HK$67.60, with returns of 10.3% decline over 7 days and 9.5% decline over 30 days, set against a 10.0% decline year to date and a 44.9% gain over 1 year, while the 3 year return is very large and the 5 year return stands at 163.0%.
- Recent headlines have focused on Semiconductor Manufacturing International's position in global chip supply and its role in broader sector capacity expansion. This helps frame why investors are reassessing the stock. Coverage has also highlighted policy and industry developments around semiconductor manufacturing that could influence how the market views its long term prospects and risks.
- Even with this backdrop, our current valuation checks produce a value score of 0 out of 6. Next we will walk through what different valuation approaches say about that result and point you to an even better way to make sense of Semiconductor Manufacturing International's worth by the end of the article.
Semiconductor Manufacturing International scores just 0/6 on our valuation checks. See what other red flags we found in the full valuation breakdown.
Approach 1: Semiconductor Manufacturing International Discounted Cash Flow (DCF) Analysis
A Discounted Cash Flow, or DCF, model estimates what a company might be worth today by projecting its future cash flows and then discounting those back into present dollars.
For Semiconductor Manufacturing International, the model uses a 2 Stage Free Cash Flow to Equity approach based on cash flow projections. The latest twelve month free cash flow is a loss of about $5,888.80m. Analysts provide explicit free cash flow estimates out to 2030, where free cash flow is projected at $3,837m, and Simply Wall St then extrapolates the following years using a tapering growth profile.
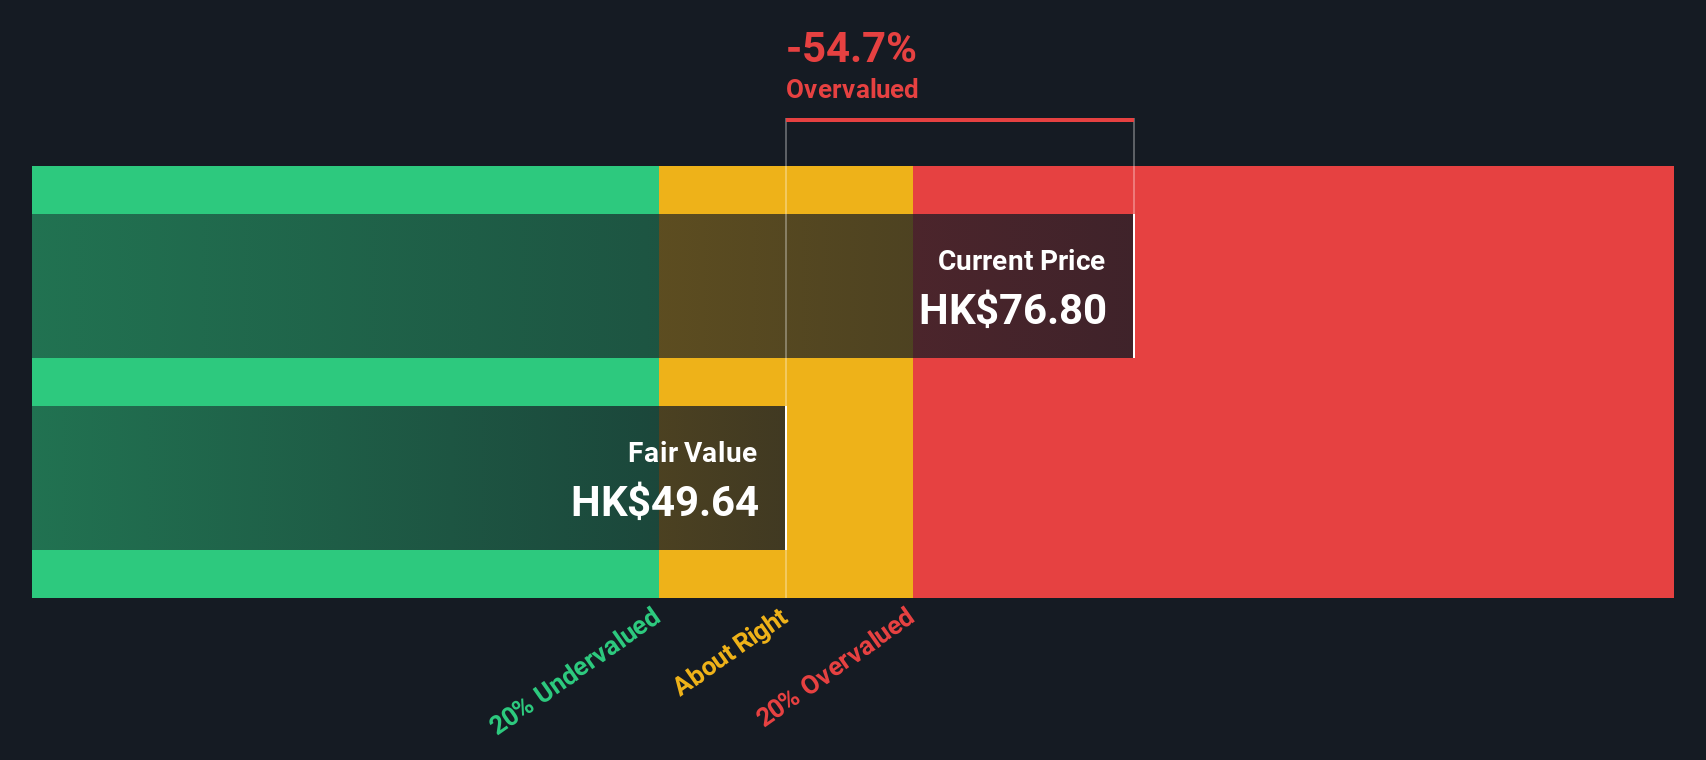
After discounting the ten year cash flow projections and the terminal value, the model arrives at an estimated intrinsic value of about HK$40.41 per share. Compared with the recent share price of HK$67.60, this DCF output suggests the shares trade at roughly a 67.3% premium to the modelled value, which screens as expensive on these cash flow assumptions.
Result: OVERVALUED
Our Discounted Cash Flow (DCF) analysis suggests Semiconductor Manufacturing International may be overvalued by 67.3%. Discover 239 high quality undervalued stocks or create your own screener to find better value opportunities.
Approach 2: Semiconductor Manufacturing International Price vs Earnings
For profitable businesses, the P/E ratio is a useful shorthand because it relates what you pay for each share directly to the earnings that business is already generating. It lets you compare different companies on the same earnings based yardstick.
What counts as a reasonable P/E typically reflects two big forces: how fast earnings are expected to grow and how much risk investors see in those earnings. Higher expected growth or lower perceived risk can support a higher P/E, while slower growth or higher risk usually points to a lower one.
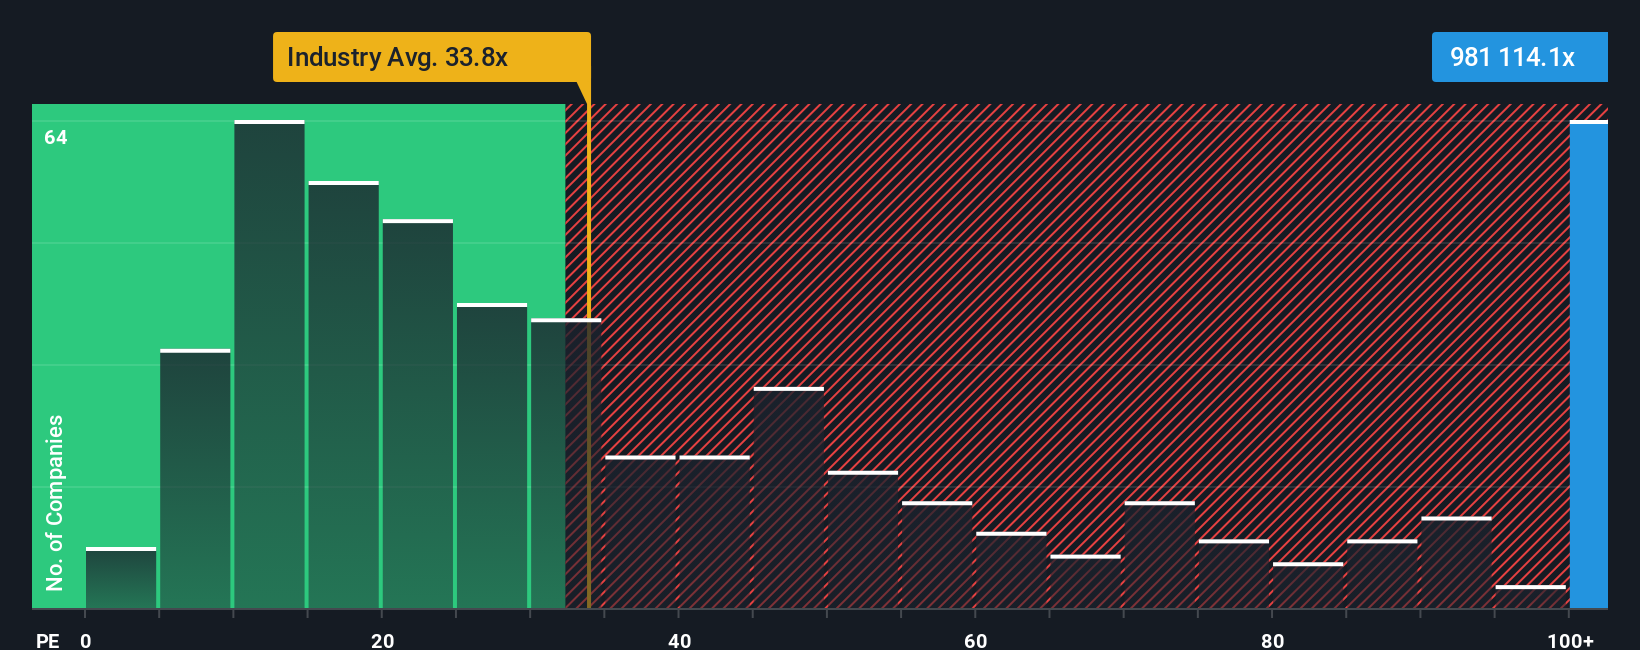
Semiconductor Manufacturing International currently trades on a P/E of 111.67x. That sits above both the Semiconductor industry average of 41.78x and the peer group average of 29.56x. Simply Wall St also calculates a proprietary “Fair Ratio” for the stock of 44.35x, which is the P/E it estimates would be appropriate given factors such as earnings growth profile, industry, profit margins, market cap and key risks.
This Fair Ratio is more tailored than a simple comparison with peers or the industry because it blends those company specific drivers into one figure. Set against the current P/E of 111.67x, the Fair Ratio suggests the shares are pricing in a richer multiple than those fundamentals alone might justify.
Result: OVERVALUED
P/E ratios tell one story, but what if the real opportunity lies elsewhere? Start investing in legacies, not executives. Discover our 105 top founder-led companies.
Upgrade Your Decision Making: Choose your Semiconductor Manufacturing International Narrative
Earlier we mentioned that there is an even better way to understand valuation, so let us introduce you to Narratives. A Narrative is simply your story for a company, where you spell out what you think is a reasonable fair value and how revenue, earnings and margins might progress, instead of relying only on a single model output. Narratives link that story to a financial forecast and then to a fair value, so you can clearly see how your view translates into numbers. On Simply Wall St, Narratives sit in the Community page, where millions of investors share these story plus numbers views in a format that is easy to follow and update. Once you have a Narrative, you can compare its Fair Value to the current share price to help decide whether Semiconductor Manufacturing International looks attractive, fully valued or expensive to you. Narratives also refresh when new information such as earnings, guidance or major news is added, so your view can stay aligned with the latest data. For Semiconductor Manufacturing International, one investor might see a much higher fair value than today’s price while another might see a much lower fair value based on more cautious margin and revenue assumptions.
Do you think there's more to the story for Semiconductor Manufacturing International? Head over to our Community to see what others are saying!
This article by Simply Wall St is general in nature. We provide commentary based on historical data and analyst forecasts only using an unbiased methodology and our articles are not intended to be financial advice. It does not constitute a recommendation to buy or sell any stock, and does not take account of your objectives, or your financial situation. We aim to bring you long-term focused analysis driven by fundamental data. Note that our analysis may not factor in the latest price-sensitive company announcements or qualitative material. Simply Wall St has no position in any stocks mentioned.
Have feedback on this article? Concerned about the content? Get in touch with us directly. Alternatively, email editorial-team@simplywallst.com
Contact Us
Contact Number :+852 3852 8500Webull Securities Limited is licensed with the Securities and Futures Commission of Hong Kong (CE No. BNG700) for carrying out Type 1 License for Dealing in Securities, Type 2 License for Dealing in Futures Contracts and Type 4 License for Advising on Securities.

English