
Risks Still Elevated At These Prices As AOM International Group Company Limited (HKG:381) Shares Dive 30%
To the annoyance of some shareholders, AOM International Group Company Limited (HKG:381) shares are down a considerable 30% in the last month, which continues a horrid run for the company. For any long-term shareholders, the last month ends a year to forget by locking in a 86% share price decline.
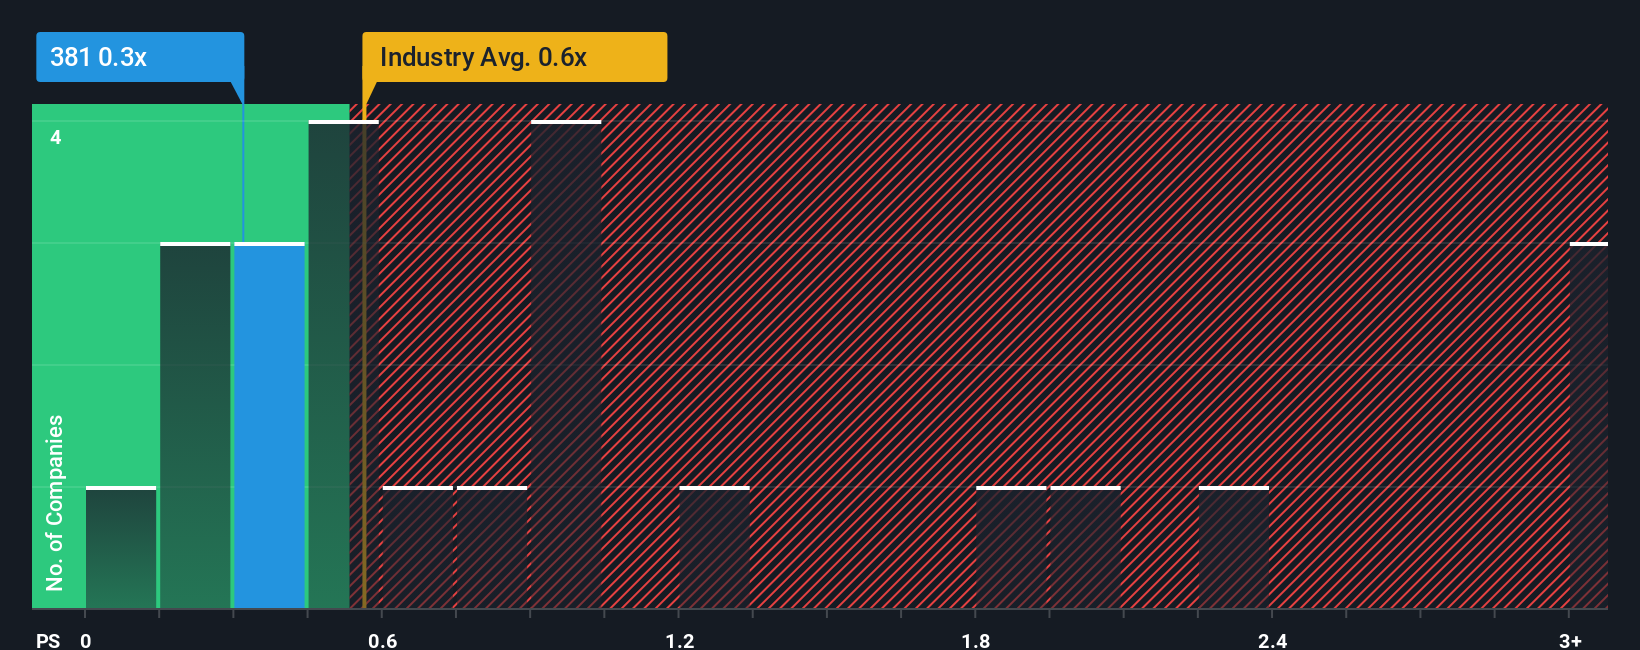
Even after such a large drop in price, it's still not a stretch to say that AOM International Group's price-to-sales (or "P/S") ratio of 0.3x right now seems quite "middle-of-the-road" compared to the Leisure industry in Hong Kong, where the median P/S ratio is around 0.6x. However, investors might be overlooking a clear opportunity or potential setback if there is no rational basis for the P/S.
View our latest analysis for AOM International Group
What Does AOM International Group's P/S Mean For Shareholders?
The revenue growth achieved at AOM International Group over the last year would be more than acceptable for most companies. Perhaps the market is expecting future revenue performance to only keep up with the broader industry, which has keeping the P/S in line with expectations. If you like the company, you'd be hoping this isn't the case so that you could potentially pick up some stock while it's not quite in favour.
Although there are no analyst estimates available for AOM International Group, take a look at this free data-rich visualisation to see how the company stacks up on earnings, revenue and cash flow.Do Revenue Forecasts Match The P/S Ratio?
In order to justify its P/S ratio, AOM International Group would need to produce growth that's similar to the industry.
If we review the last year of revenue growth, the company posted a terrific increase of 19%. Still, revenue has barely risen at all from three years ago in total, which is not ideal. So it appears to us that the company has had a mixed result in terms of growing revenue over that time.
Comparing that to the industry, which is predicted to deliver 11% growth in the next 12 months, the company's momentum is weaker, based on recent medium-term annualised revenue results.
With this information, we find it interesting that AOM International Group is trading at a fairly similar P/S compared to the industry. Apparently many investors in the company are less bearish than recent times would indicate and aren't willing to let go of their stock right now. Maintaining these prices will be difficult to achieve as a continuation of recent revenue trends is likely to weigh down the shares eventually.
The Bottom Line On AOM International Group's P/S
With its share price dropping off a cliff, the P/S for AOM International Group looks to be in line with the rest of the Leisure industry. It's argued the price-to-sales ratio is an inferior measure of value within certain industries, but it can be a powerful business sentiment indicator.
Our examination of AOM International Group revealed its poor three-year revenue trends aren't resulting in a lower P/S as per our expectations, given they look worse than current industry outlook. When we see weak revenue with slower than industry growth, we suspect the share price is at risk of declining, bringing the P/S back in line with expectations. If recent medium-term revenue trends continue, the probability of a share price decline will become quite substantial, placing shareholders at risk.
Plus, you should also learn about these 3 warning signs we've spotted with AOM International Group.
If strong companies turning a profit tickle your fancy, then you'll want to check out this free list of interesting companies that trade on a low P/E (but have proven they can grow earnings).
Have feedback on this article? Concerned about the content? Get in touch with us directly. Alternatively, email editorial-team (at) simplywallst.com.
This article by Simply Wall St is general in nature. We provide commentary based on historical data and analyst forecasts only using an unbiased methodology and our articles are not intended to be financial advice. It does not constitute a recommendation to buy or sell any stock, and does not take account of your objectives, or your financial situation. We aim to bring you long-term focused analysis driven by fundamental data. Note that our analysis may not factor in the latest price-sensitive company announcements or qualitative material. Simply Wall St has no position in any stocks mentioned.
Contact Us
Contact Number : +852 3852 8500Webull Securities Limited is licensed with the Securities and Futures Commission of Hong Kong (CE No. BNG700) for carrying out Type 1 License for Dealing in Securities, Type 2 License for Dealing in Futures Contracts and Type 4 License for Advising on Securities.

English