
Asian Market Picks: Mao Geping Cosmetics And 2 Other Stocks That May Be Priced Below Their Estimated Value
As global markets navigate a period of volatility, with technology stocks experiencing setbacks and value-oriented sectors gaining traction, investors are increasingly turning their attention to the Asian markets for potential opportunities. In this environment, identifying undervalued stocks can be particularly appealing, as they may offer growth potential when market conditions shift.
Top 10 Undervalued Stocks Based On Cash Flows In Asia
| Name | Current Price | Fair Value (Est) | Discount (Est) |
| Zhaojin Mining Industry (SEHK:1818) | HK$32.60 | HK$63.96 | 49% |
| Sino Medical Sciences Technology (SHSE:688108) | CN¥22.47 | CN¥44.74 | 49.8% |
| Sichuan Kelun-Biotech Biopharmaceutical (SEHK:6990) | HK$437.20 | HK$862.98 | 49.3% |
| Ningxia Building Materials GroupLtd (SHSE:600449) | CN¥13.56 | CN¥26.71 | 49.2% |
| Morimatsu International Holdings (SEHK:2155) | HK$10.28 | HK$20.55 | 50% |
| Helens International Holdings (SEHK:9869) | HK$0.89 | HK$1.76 | 49.4% |
| Guoquan Food (Shanghai) (SEHK:2517) | HK$4.13 | HK$8.23 | 49.8% |
| FIT Hon Teng (SEHK:6088) | HK$5.54 | HK$11.00 | 49.6% |
| CURVES HOLDINGS (TSE:7085) | ¥771.00 | ¥1519.05 | 49.2% |
| BEAUTY GARAGE (TSE:3180) | ¥1416.00 | ¥2830.72 | 50% |
We're going to check out a few of the best picks from our screener tool.
Mao Geping Cosmetics (SEHK:1318)
Overview: Mao Geping Cosmetics Co., Ltd. operates in China, offering color cosmetics and skincare products under the MAOGEPING and Love Keeps brands, with a market cap of HK$43.99 billion.
Operations: The company's revenue is primarily derived from its personal products segment, totaling CN¥4.50 billion.
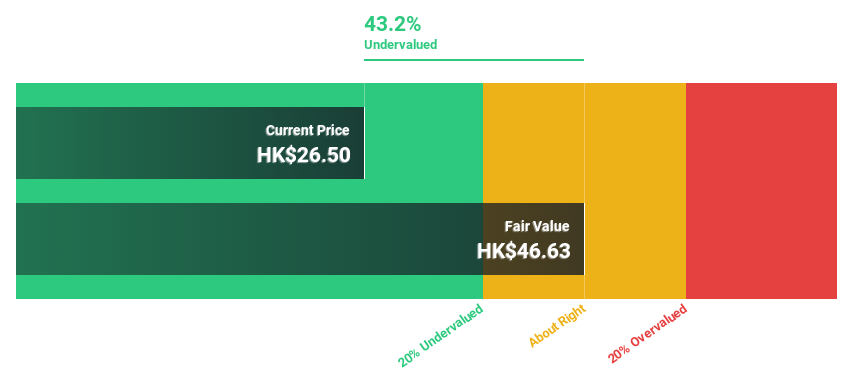
Estimated Discount To Fair Value: 29.5%
Mao Geping Cosmetics is trading at HK$89.75, significantly undervalued compared to its estimated future cash flow value of HK$127.26. The company anticipates robust annual profit growth of 24.4%, outpacing the Hong Kong market's 12.3%. Recent strategic alliances with L Catterton Asia Advisors aim to enhance global expansion and capital structure optimization, potentially boosting long-term development and further supporting its strong revenue growth forecast of 25% annually.
- The analysis detailed in our Mao Geping Cosmetics growth report hints at robust future financial performance.
- Click here to discover the nuances of Mao Geping Cosmetics with our detailed financial health report.
RemeGen (SEHK:9995)
Overview: RemeGen Co., Ltd. is a biopharmaceutical company engaged in the discovery, development, production, and commercialization of biological drugs for autoimmune, oncology, and ophthalmic diseases in Mainland China and the United States with a market cap of approximately HK$59.41 billion.
Operations: The company's revenue from biopharmaceutical research, service, production, and sales amounts to CN¥2.23 billion.
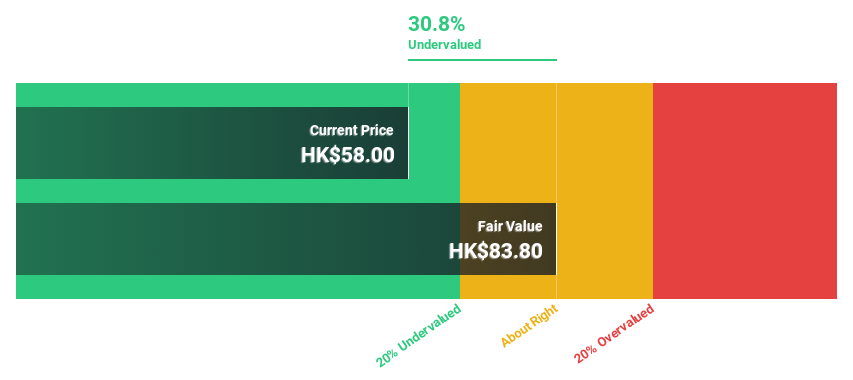
Estimated Discount To Fair Value: 35.5%
RemeGen Co., Ltd. is trading at HK$82.5, significantly undervalued relative to its estimated future cash flow value of HK$127.91. The company projects a substantial revenue increase of 22.9% annually, surpassing the Hong Kong market's growth rate, while earnings are set to grow 45.42% per year as it achieves profitability within three years. Recent developments include an exclusive licensing agreement with AbbVie for RC148 and a share buyback program funded by internal resources, supporting potential value enhancement for investors.
- Our comprehensive growth report raises the possibility that RemeGen is poised for substantial financial growth.
- Navigate through the intricacies of RemeGen with our comprehensive financial health report here.
Japan Elevator Service HoldingsLtd (TSE:6544)
Overview: Japan Elevator Service Holdings Co., Ltd. specializes in the repair, maintenance, and modernization of elevators and escalators in Japan with a market cap of ¥307.47 billion.
Operations: The company generates revenue primarily from its Maintenance Business, which accounts for ¥53.02 billion.
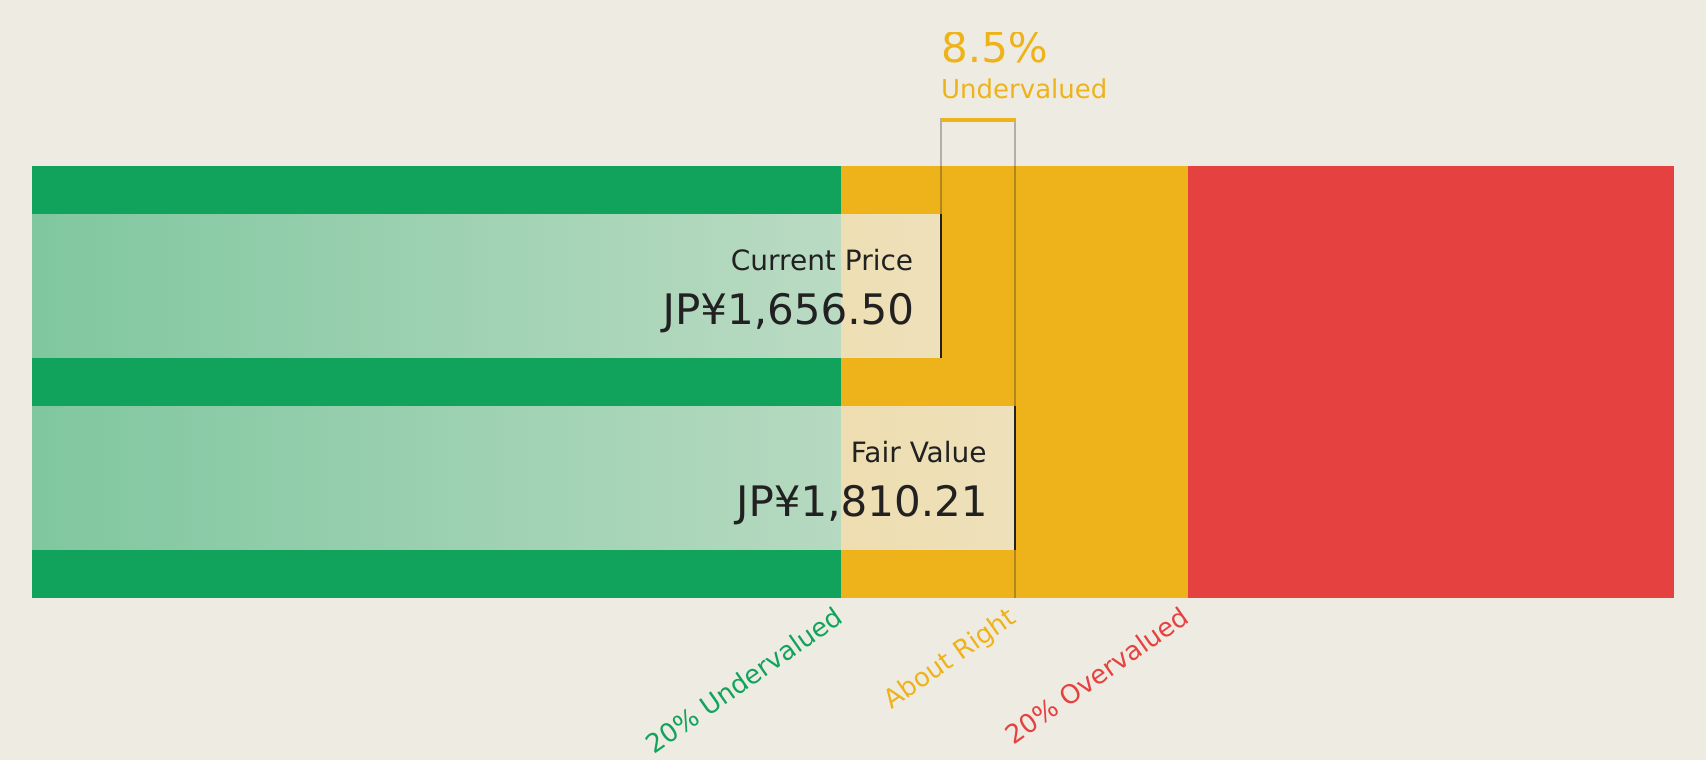
Estimated Discount To Fair Value: 16.3%
Japan Elevator Service Holdings Ltd. is trading at ¥1,720, slightly undervalued compared to its estimated future cash flow value of ¥2,055.77. Analysts expect a 41.9% stock price rise and forecast earnings to grow 17.78% annually, outpacing the Japanese market's growth rate of 9.2%. Despite a recent dividend reduction due to strategic reserve allocation for business development, the company maintains strong profit growth potential with high forecasted return on equity and revenue growth above market averages.
- The growth report we've compiled suggests that Japan Elevator Service HoldingsLtd's future prospects could be on the up.
- Click here and access our complete balance sheet health report to understand the dynamics of Japan Elevator Service HoldingsLtd.
Seize The Opportunity
- Investigate our full lineup of 236 Undervalued Asian Stocks Based On Cash Flows right here.
- Are these companies part of your investment strategy? Use Simply Wall St to consolidate your holdings into a portfolio and gain insights with our comprehensive analysis tools.
- Simply Wall St is your key to unlocking global market trends, a free user-friendly app for forward-thinking investors.
Curious About Other Options?
- Explore high-performing small cap companies that haven't yet garnered significant analyst attention.
- Diversify your portfolio with solid dividend payers offering reliable income streams to weather potential market turbulence.
- Fuel your portfolio with companies showing strong growth potential, backed by optimistic outlooks both from analysts and management.
This article by Simply Wall St is general in nature. We provide commentary based on historical data and analyst forecasts only using an unbiased methodology and our articles are not intended to be financial advice. It does not constitute a recommendation to buy or sell any stock, and does not take account of your objectives, or your financial situation. We aim to bring you long-term focused analysis driven by fundamental data. Note that our analysis may not factor in the latest price-sensitive company announcements or qualitative material. Simply Wall St has no position in any stocks mentioned.
Have feedback on this article? Concerned about the content? Get in touch with us directly. Alternatively, email editorial-team@simplywallst.com
Contact Us
Contact Number :+852 3852 8500Webull Securities Limited is licensed with the Securities and Futures Commission of Hong Kong (CE No. BNG700) for carrying out Type 1 License for Dealing in Securities, Type 2 License for Dealing in Futures Contracts and Type 4 License for Advising on Securities.

English