
Horizon Robotics (SEHK:9660) Valuation In Focus As Earnings And Auto AI Design Wins Near
Investor focus on Horizon Robotics (SEHK:9660) has picked up as the 23 March 2026 earnings date approaches, with attention on AI adoption by Chinese automakers and potential updates on OEM design wins.
See our latest analysis for Horizon Robotics.
At a latest share price of HK$8.68, Horizon Robotics has seen short term share price momentum pick up, with a 1 day share price return of 1.28% and 7 day share price return of 9.05%. This comes even though the 30 day share price return is negative and the year to date share price return is slightly negative. The 1 year total shareholder return of 47.87% points to stronger longer term sentiment as investors weigh upcoming earnings and AI OEM deals.
If AI demand in autos has your attention, it could be a good moment to see what else is moving in this space through our list of 58 profitable AI stocks that aren't just burning cash.
With earnings approaching and the share price still below the HK$12.21 analyst target, the real question is whether Horizon Robotics is still misunderstood value, or if the market is already pricing in future AI growth?
Preferred P/E of 50.8x: Is it justified?
On a P/E of 50.8x at a share price of HK$8.68, Horizon Robotics is priced well above the fair P/E estimate but sits below the average for direct peers.
The P/E multiple tells you how much investors are paying for each unit of current earnings, which is often important for high growth software and AI linked businesses. In Horizon Robotics' case, the company has only recently moved into profitability and earnings are forecast to grow at 18.5% a year, which helps explain why the market is willing to pay a higher multiple than the fair P/E of 31.7x suggests.
Compared with the Asian Software industry average P/E of 25x, Horizon Robotics is on a materially richer valuation, which implies investors are pricing in stronger revenue growth of 27.2% a year and the potential of automotive AI solutions. Yet relative to a peer average P/E of 57.8x, the current 50.8x implies some room for sentiment to catch up or for fundamentals to grow into the multiple if forecasts hold.
Explore the SWS fair ratio for Horizon Robotics
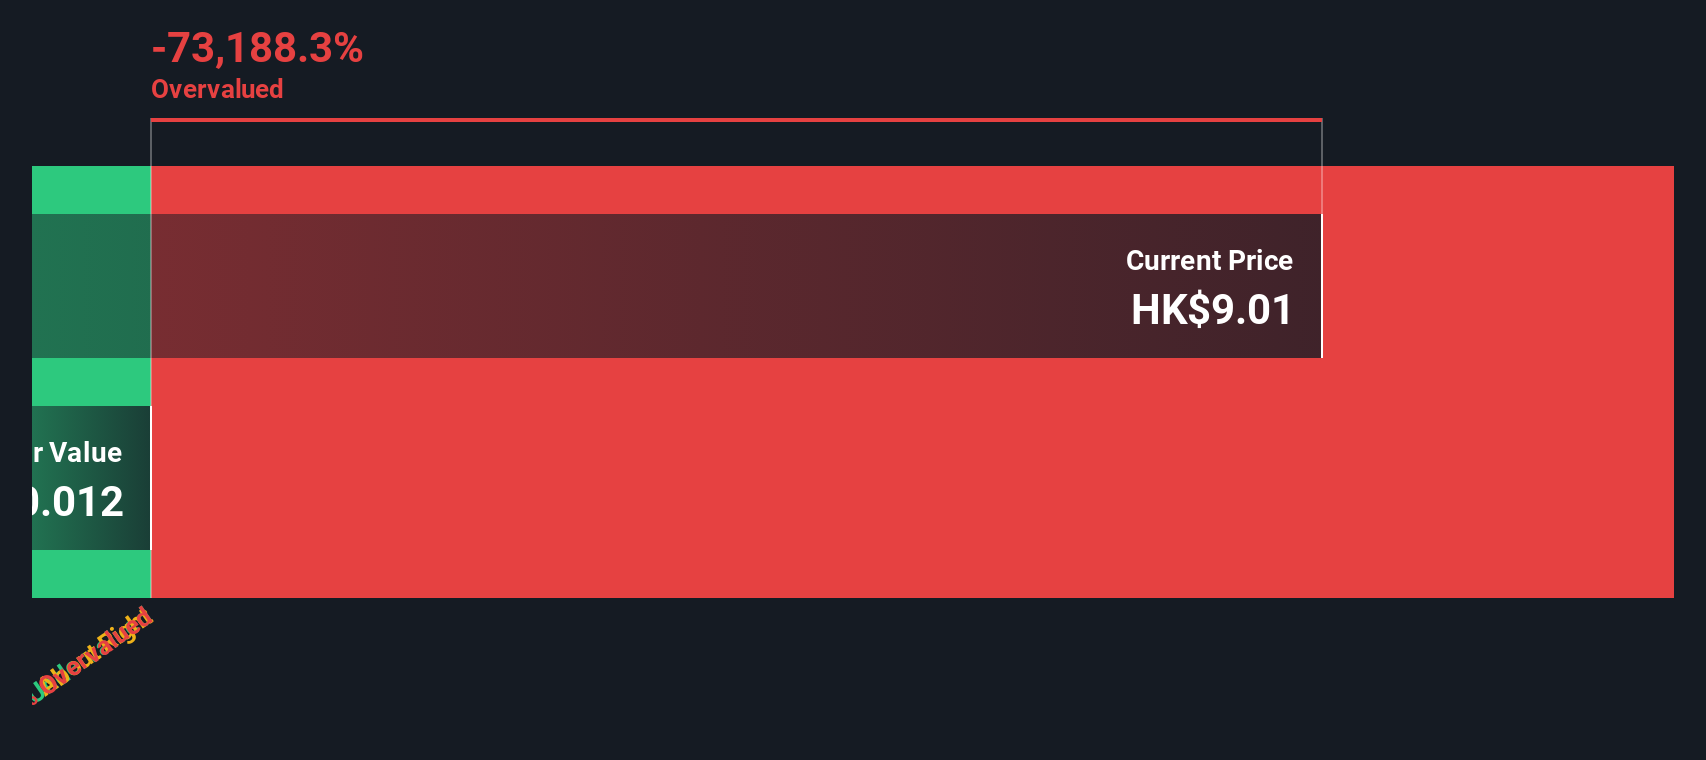
Result: Price-to-earnings of 50.8x (OVERVALUED)
However, investors still face key risks, including any slowdown in revenue growth from HK$3,015.711 million, as well as potential setbacks in automotive OEM adoption of Horizon solutions.
Find out about the key risks to this Horizon Robotics narrative.
Another view using our DCF model
The P/E story points to Horizon Robotics being expensive at 50.8x compared with a fair ratio of 31.7x, but our DCF model goes even further. On this method, the company looks overvalued too, with our estimate of future cash flow value at HK$3.30 per share versus the HK$8.68 market price. So how should you weigh a rich multiple and a cautious cash flow view against upbeat growth expectations?
Look into how the SWS DCF model arrives at its fair value.
Simply Wall St performs a discounted cash flow (DCF) on every stock in the world every day (check out Horizon Robotics for example). We show the entire calculation in full. You can track the result in your watchlist or portfolio and be alerted when this changes, or use our stock screener to discover 223 high quality undervalued stocks. If you save a screener we even alert you when new companies match - so you never miss a potential opportunity.
Build Your Own Horizon Robotics Narrative
If you look at the numbers and see a different story, or simply prefer to test your own view, you can build a personalised Horizon Robotics thesis in just a few minutes with Do it your way.
A great starting point for your Horizon Robotics research is our analysis highlighting 3 key rewards and 1 important warning sign that could impact your investment decision.
Ready for more investment ideas?
If Horizon Robotics has sharpened your curiosity, do not stop here. Broaden your watchlist with other focused stock ideas that match different goals and risk levels.
- Target potential mispricings by scanning a curated set of 223 high quality undervalued stocks that pair quality fundamentals with what may be attractive entry points.
- Strengthen your income focus by reviewing 429 dividend fortresses, where yields and consistency work together for investors who care about ongoing cash returns.
- Dial down risk by assessing 330 resilient stocks with low risk scores, a group of companies screened for more resilient profiles that can help steady your overall portfolio.
This article by Simply Wall St is general in nature. We provide commentary based on historical data and analyst forecasts only using an unbiased methodology and our articles are not intended to be financial advice. It does not constitute a recommendation to buy or sell any stock, and does not take account of your objectives, or your financial situation. We aim to bring you long-term focused analysis driven by fundamental data. Note that our analysis may not factor in the latest price-sensitive company announcements or qualitative material. Simply Wall St has no position in any stocks mentioned.
Have feedback on this article? Concerned about the content? Get in touch with us directly. Alternatively, email editorial-team@simplywallst.com
Contact Us
Contact Number :+852 3852 8500Webull Securities Limited is licensed with the Securities and Futures Commission of Hong Kong (CE No. BNG700) for carrying out Type 1 License for Dealing in Securities, Type 2 License for Dealing in Futures Contracts and Type 4 License for Advising on Securities.

English