
Is New Oriental Education & Technology Group (EDU) Fairly Priced After Recent Share Price Swings
- If you are wondering whether New Oriental Education & Technology Group's share price around US$58.70 reflects its real worth, you are not alone. This article focuses on what the numbers say about value.
- The stock has had mixed returns, with a 6.4% gain over the past month, a 6.4% decline over the last 7 days, and longer term moves including 7.0% over 1 year, 43.4% over 3 years, and a 68.9% decline over 5 years. These figures can change how investors view both potential and risk.
- Recent coverage around New Oriental has continued to focus on its role in the education sector and how it fits within broader themes for US listed Chinese companies, which helps frame those share price moves. That context is useful background as we separate sentiment from what the valuation tools indicate.
- On our checks, New Oriental scores 2 out of 6 on valuation, as shown by its value score of 2. We will walk through what different valuation methods suggest about the stock, before finishing with a more complete way to think about value at the end of the article.
New Oriental Education & Technology Group scores just 2/6 on our valuation checks. See what other red flags we found in the full valuation breakdown.
Approach 1: New Oriental Education & Technology Group Discounted Cash Flow (DCF) Analysis
A Discounted Cash Flow, or DCF, model looks at the cash New Oriental Education & Technology Group is expected to generate in the future and discounts those projected cash flows back to what they could be worth in today's dollars.
New Oriental's latest twelve month Free Cash Flow is about $656.4 million. Analysts have supplied several years of Free Cash Flow estimates, and beyond that Simply Wall St extends the projections using its own assumptions. Under this 2 Stage Free Cash Flow to Equity approach, Free Cash Flow is projected at $585.4 million in 2035, all in US$.
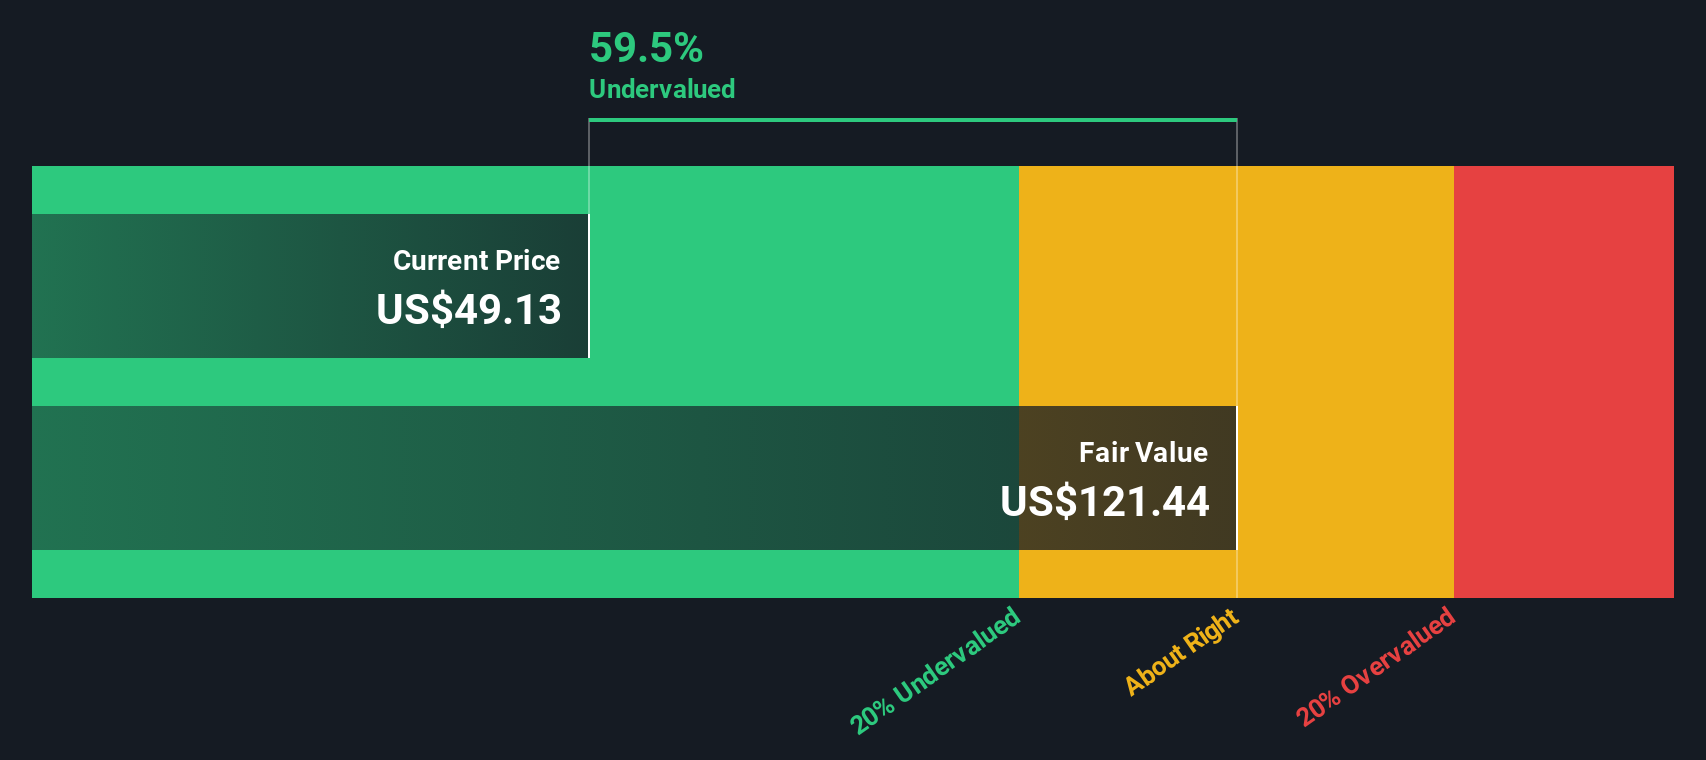
When all those future cash flows are discounted back and added up, the model arrives at an estimated intrinsic value of about $69.80 per share. The recent share price is around $58.70. On this basis, the DCF output suggests the stock trades at roughly a 15.9% discount and appears undervalued according to this method alone.
Result: UNDERVALUED
Our Discounted Cash Flow (DCF) analysis suggests New Oriental Education & Technology Group is undervalued by 15.9%. Track this in your watchlist or portfolio, or discover 53 more high quality undervalued stocks.
Approach 2: New Oriental Education & Technology Group Price vs Earnings
For a profitable business like New Oriental Education & Technology Group, the P/E ratio is a useful way to think about value because it links what you pay today to the earnings the company is already generating.
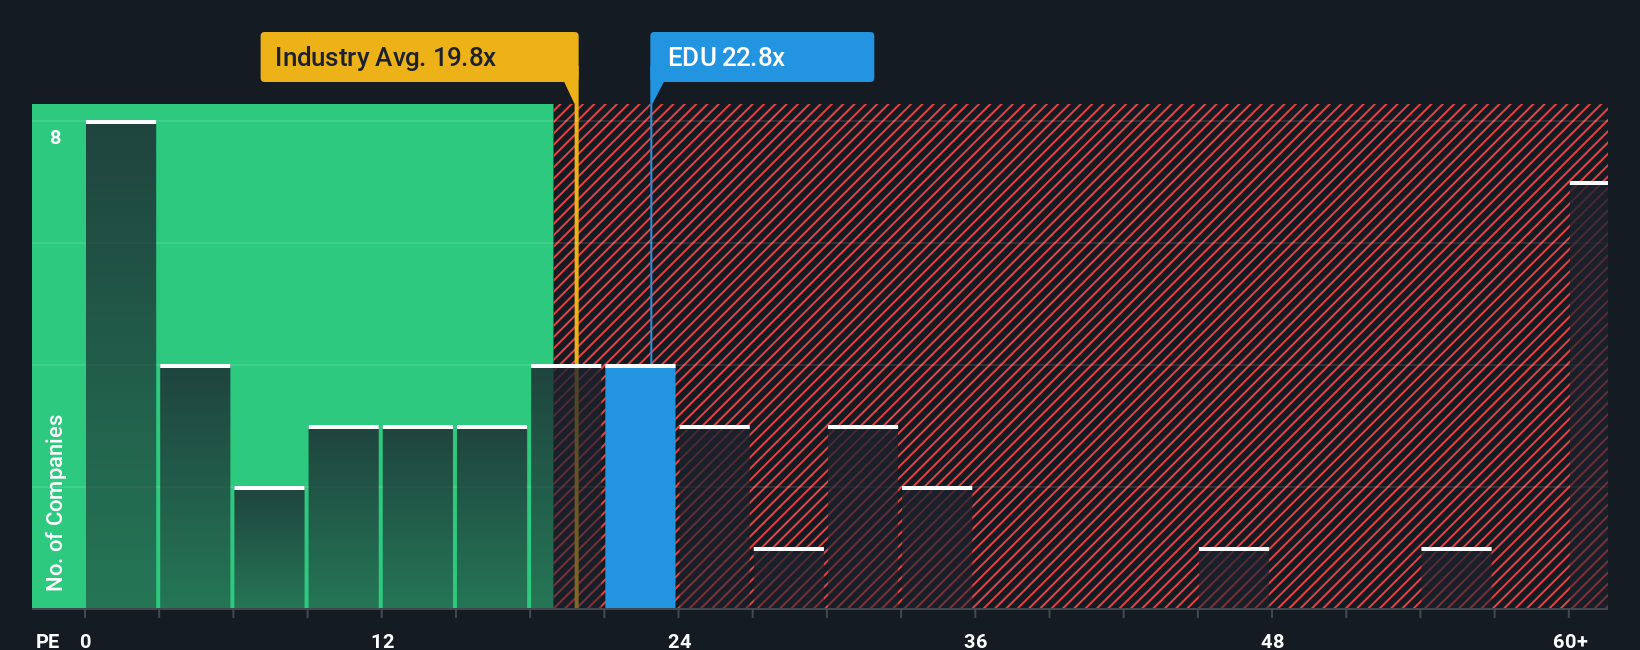
In simple terms, higher growth expectations or lower perceived risk can justify a higher P/E, while slower expected growth or higher risk usually line up with a lower, more cautious multiple. With that in mind, New Oriental currently trades on a P/E of 24.55x. This sits above the Consumer Services industry average of 17.68x and the peer average of 16.00x, which on a simple comparison can make the shares look relatively expensive.
Simply Wall St’s Fair Ratio for New Oriental is 24.88x. This is a proprietary estimate of what a “normal” P/E might look like for the company given factors such as its earnings profile, industry, profit margin, market cap and key risks. That makes it more tailored than a basic peer or industry comparison, which treats all companies as if they were interchangeable.
Comparing the Fair Ratio of 24.88x with the current P/E of 24.55x, the stock screens as about right on this measure.
Result: ABOUT RIGHT
P/E ratios tell one story, but what if the real opportunity lies elsewhere? Start investing in legacies, not executives. Discover our 23 top founder-led companies.
Upgrade Your Decision Making: Choose your New Oriental Education & Technology Group Narrative
Earlier we mentioned that there is an even better way to understand valuation. Narratives on Simply Wall St's Community page let you attach your own story about New Oriental Education & Technology Group to the numbers by linking your view of its future revenue, earnings and margins to a forecast and a fair value. You can then compare that fair value to the current price to see whether, in your opinion, it looks attractive or not, and update that view automatically as new earnings or news arrive. This is why one investor might choose a more optimistic New Oriental Narrative built around a US$80.00 fair value with higher margins and a lower future P/E of 15.67x. Another investor might prefer a more cautious Narrative closer to US$38.90 with revenue growth of 6.8% and a future P/E of 16.28x. Both investors are looking at the same company but using different assumptions to guide their own decisions.
For New Oriental Education & Technology Group however we will make it really easy for you with previews of two leading New Oriental Education & Technology Group Narratives:
🐂 New Oriental Education & Technology Group Bull Case
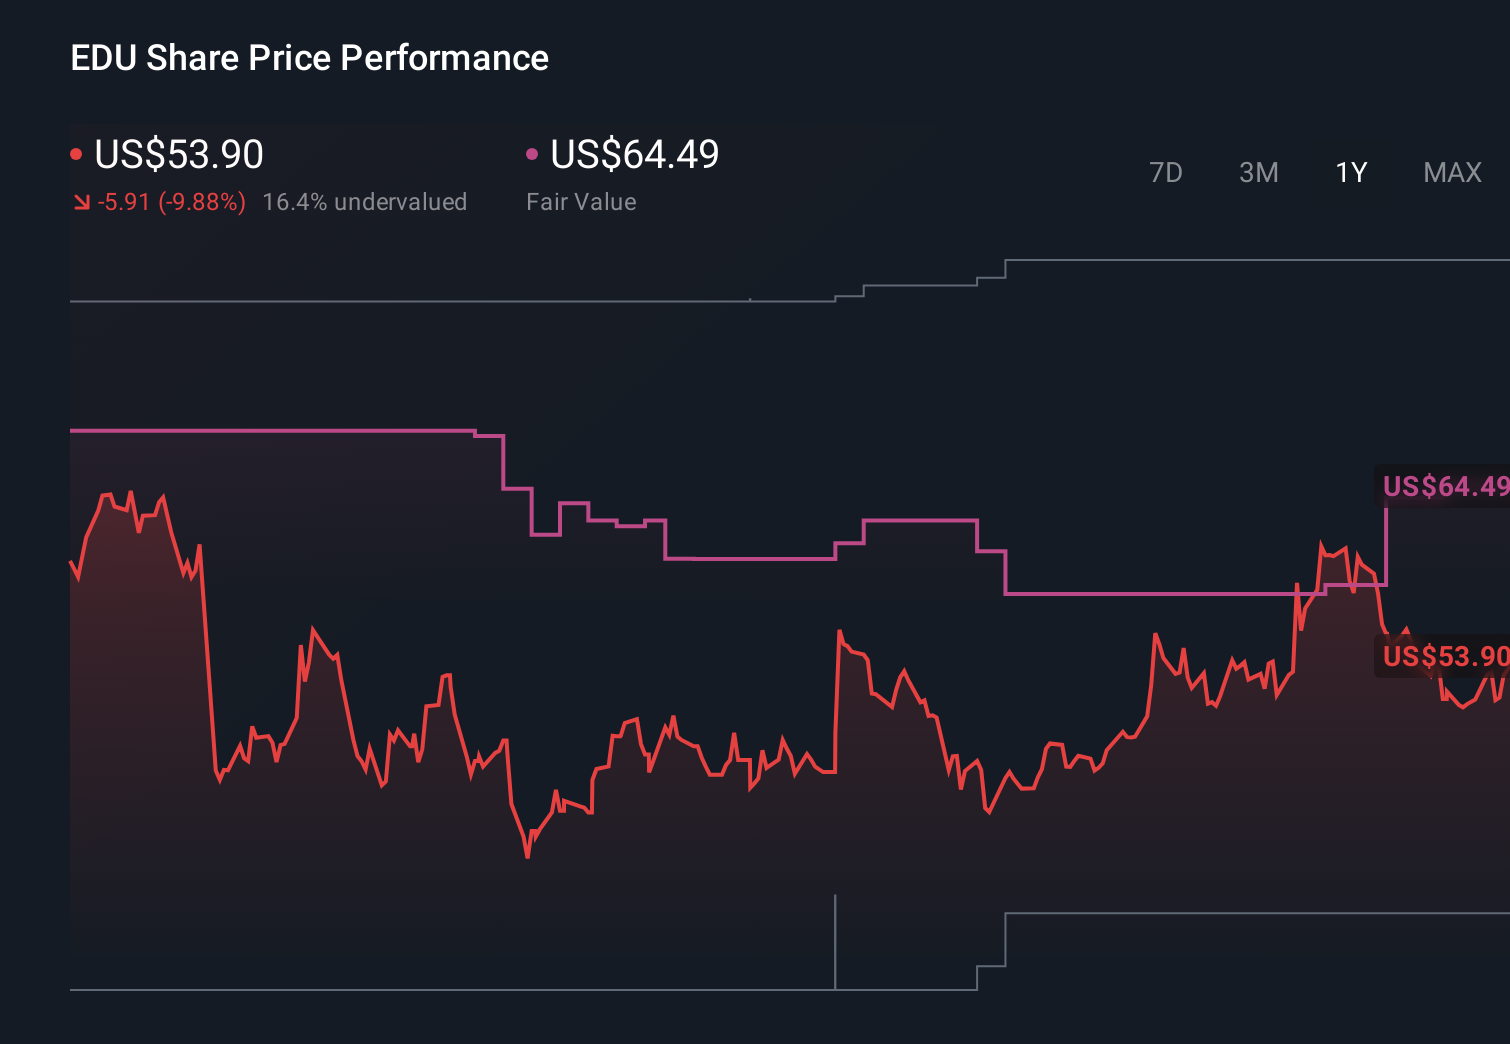
Fair value: US$64.49 per share
Implied discount to this fair value: around 9% based on the latest close of US$58.70
Revenue growth assumption: 9.64% a year
- Focuses on non academic tutoring, AI powered learning and omnichannel delivery as key drivers for revenue growth and higher margins.
- Emphasises cash flow visibility, rising deferred revenue and an active capital return plan that includes buybacks and dividends.
- Flags risks around competition, regulation, newer business lines and the possibility that margin gains slow from here.
🐻 New Oriental Education & Technology Group Bear Case
Fair value: US$38.90 per share
Implied premium to this fair value: around 51% based on the latest close of US$58.70
Revenue growth assumption: 6.83% a year
- Highlights demographic pressures, regulation and higher fixed costs as potential headwinds for long term enrollment, revenue and margins.
- Sees rising competition from EdTech and digital learning as a risk for market share and earnings stability despite New Oriental's own digital efforts.
- Uses the lower end of analyst assumptions around earnings, margins and future P/E to arrive at a fair value that sits close to the bearish price target cluster.
Both narratives are built from the same underlying data. They simply lean on different assumptions about growth, margins and how the market could value those future earnings. The useful exercise for you is to decide which set of assumptions feels more realistic, or to adjust them further so the story matches your own view of New Oriental Education & Technology Group.
Do you think there's more to the story for New Oriental Education & Technology Group? Head over to our Community to see what others are saying!
This article by Simply Wall St is general in nature. We provide commentary based on historical data and analyst forecasts only using an unbiased methodology and our articles are not intended to be financial advice. It does not constitute a recommendation to buy or sell any stock, and does not take account of your objectives, or your financial situation. We aim to bring you long-term focused analysis driven by fundamental data. Note that our analysis may not factor in the latest price-sensitive company announcements or qualitative material. Simply Wall St has no position in any stocks mentioned.
Have feedback on this article? Concerned about the content? Get in touch with us directly. Alternatively, email editorial-team@simplywallst.com
Contact Us
Contact Number :+852 3852 8500Webull Securities Limited is licensed with the Securities and Futures Commission of Hong Kong (CE No. BNG700) for carrying out Type 1 License for Dealing in Securities, Type 2 License for Dealing in Futures Contracts and Type 4 License for Advising on Securities.

English