
A Look At Bright Smart Securities (SEHK:1428) Valuation As Index Inclusion And Stock Connect Eligibility Approach
Bright Smart Securities & Commodities Group (SEHK:1428) is set to join the Hang Seng Composite Index, with the change effective March 9, 2026. This inclusion also paves the way for Shanghai Hong Kong Stock Connect eligibility.
See our latest analysis for Bright Smart Securities & Commodities Group.
The upcoming index inclusion sits on top of a strong run, with a 90 day share price return of 25% and a 1 year total shareholder return of 247.33% pointing to building momentum rather than fading interest.
If this news has you looking beyond a single broker, it could be a good moment to broaden your search and check out 103 top founder-led companies as potential next ideas.
With Bright Smart already posting a 247.33% 1 year total shareholder return and a value score of 1, plus index inclusion on the way, investors may reasonably ask whether there is still upside available or whether the market is already fully pricing in future growth.
Preferred P/E of 24.4x: Is it justified?
Bright Smart currently trades on a P/E of 24.4x, which sits above the Hong Kong Capital Markets industry average of 20.2x, so the market is paying a premium for its earnings.
The P/E ratio compares the HK$9.1 share price to the company’s earnings per share and is a common way investors look at brokerages and capital markets firms, where profitability can be sensitive to trading volumes and leverage. A higher P/E like 24.4x often reflects stronger recent results, improved sentiment, or expectations that current earnings will be sustained.
Against its immediate peer group, Bright Smart’s 24.4x P/E is below the peer average of 63.2x, which shows the wider set of comparable companies is trading at much richer earnings multiples. Compared to the broader Hong Kong Capital Markets industry however, the stock is on the expensive side, with its P/E sitting clearly above the 20.2x industry average.
See what the numbers say about this price — find out in our valuation breakdown.
Result: Price-to-Earnings of 24.4x (ABOUT RIGHT)
What the fundamentals say beyond the index news
On the quality side, Bright Smart’s recent earnings picture is mixed. Reported earnings carry a high level of non cash items, which can make headline profit less reflective of underlying cash profitability. The company’s net profit margin is currently 54%, compared with 57.1% last year, so profitability remains high in absolute terms but is slightly lower than the prior period.
Looking over a longer stretch, earnings have declined by 1.1% per year over the past 5 years, even though earnings growth over the most recent year was 11.5%. That means the latest improvement sits against a backdrop of earlier declines, which can matter for anyone trying to judge how repeatable the current earnings profile might be.
Return on equity sits at 34.59%, which is high based on a 20% reference threshold, but this figure is skewed by the company’s high level of debt. Debt is also not well covered by operating cash flow, and 100% of liabilities come from higher risk funding sources such as external borrowing rather than customer deposits, which can increase sensitivity to funding conditions.
On the governance front, Bright Smart has a seasoned management team with an average tenure of 15.3 years and a board that is also experienced, with an average tenure of 15.5 years. Around 57% of directors are independent, and the company has brought in one new director over the past 3 years, which suggests some refreshment alongside continuity.
CEO Edmond’s total compensation of US$1.66m is above the average for companies of similar size in the Hong Kong market, and his pay increased by more than 20% in the past year. Some investors may see that as aligning with the recent strong share price performance, while others may want to weigh it against the longer term earnings track record and the current balance sheet risk profile.
However, the extensive use of higher risk funding and a 1.1% annual earnings decline over 5 years could challenge the recent momentum if conditions become less favourable.
Find out about the key risks to this Bright Smart Securities & Commodities Group narrative.
Another view from our DCF model
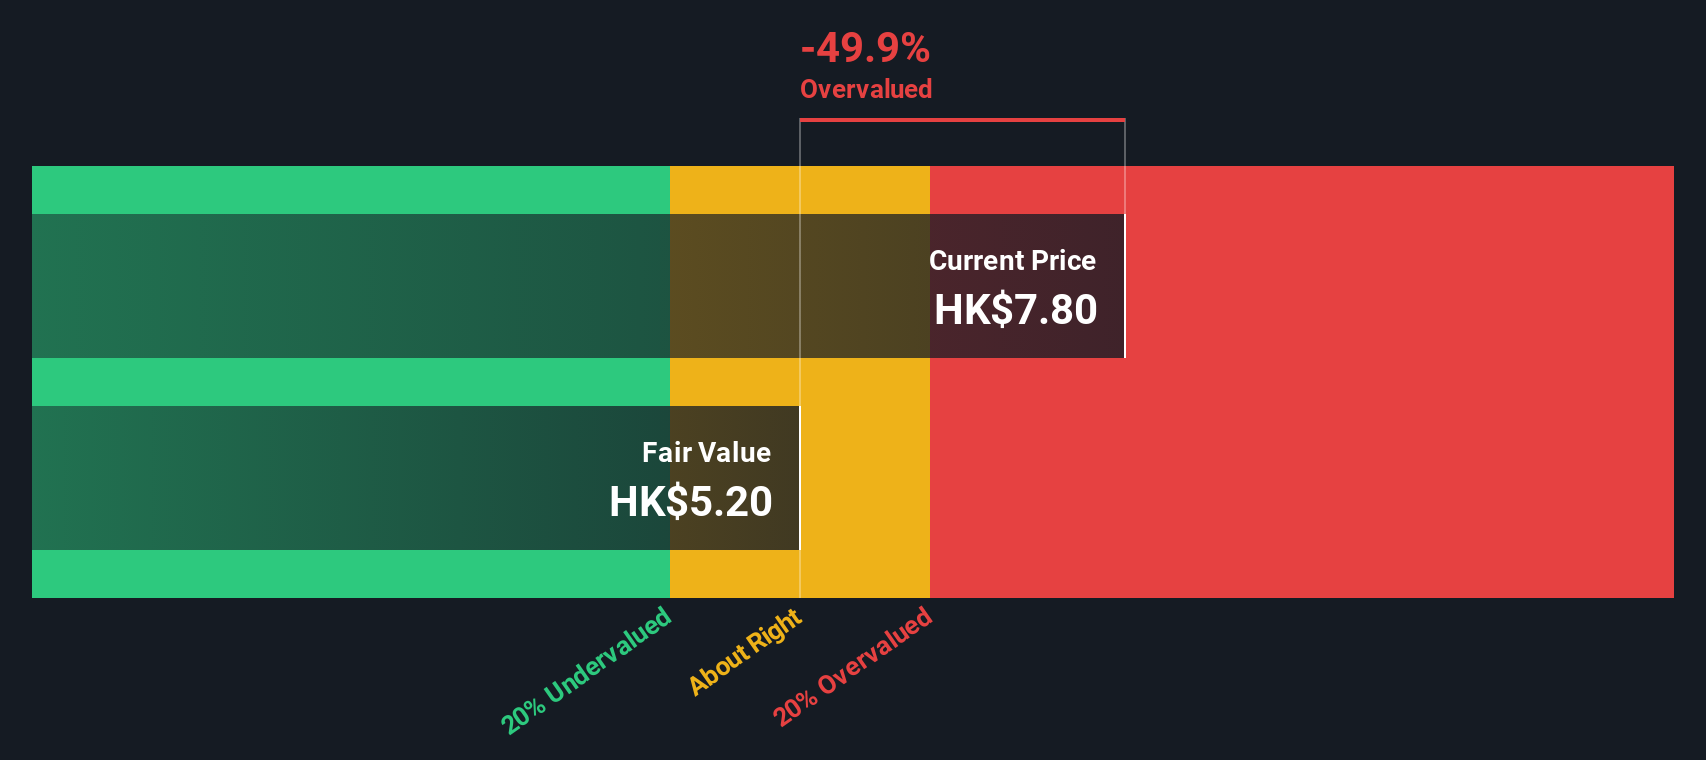
While the 24.4x P/E suggests Bright Smart is priced at a premium to the Hong Kong Capital Markets average, our DCF model points in the same direction. At HK$9.1, the share price sits above an estimated future cash flow value of HK$5.76, which implies limited room for error if conditions change.
Look into how the SWS DCF model arrives at its fair value.
Simply Wall St performs a discounted cash flow (DCF) on every stock in the world every day (check out Bright Smart Securities & Commodities Group for example). We show the entire calculation in full. You can track the result in your watchlist or portfolio and be alerted when this changes, or use our stock screener to discover 224 high quality undervalued stocks. If you save a screener we even alert you when new companies match - so you never miss a potential opportunity.
Build Your Own Bright Smart Securities & Commodities Group Narrative
If you see the numbers differently or prefer to test your own assumptions, you can pull the data together and build a tailored view in just a few minutes, then Do it your way.
A great starting point for your Bright Smart Securities & Commodities Group research is our analysis highlighting 3 important warning signs that could impact your investment decision.
Looking for more investment ideas?
If you only stop at one stock, you could miss opportunities that fit your style even better. Put a few minutes aside to scan for ideas that match your risk tolerance and goals.
- Target value first by checking our list of 224 high quality undervalued stocks that pair solid fundamentals with prices that may leave room for a margin of safety.
- Prioritise resilience through our 325 resilient stocks with low risk scores, focusing on companies with metrics that point to steadier profiles when conditions change.
- Spot potential early stage opportunities using the 229 elite penny stocks with strong financials, where smaller names can offer different risk and reward trade offs to larger peers.
This article by Simply Wall St is general in nature. We provide commentary based on historical data and analyst forecasts only using an unbiased methodology and our articles are not intended to be financial advice. It does not constitute a recommendation to buy or sell any stock, and does not take account of your objectives, or your financial situation. We aim to bring you long-term focused analysis driven by fundamental data. Note that our analysis may not factor in the latest price-sensitive company announcements or qualitative material. Simply Wall St has no position in any stocks mentioned.
Have feedback on this article? Concerned about the content? Get in touch with us directly. Alternatively, email editorial-team@simplywallst.com
Contact Us
Contact Number : +852 3852 8500Webull Securities Limited is licensed with the Securities and Futures Commission of Hong Kong (CE No. BNG700) for carrying out Type 1 License for Dealing in Securities, Type 2 License for Dealing in Futures Contracts and Type 4 License for Advising on Securities.

English