
Is New Oriental Education & Technology Group (EDU) Attractively Priced After Recent Share Price Weakness
- If you are wondering whether New Oriental Education & Technology Group is attractively priced at its current level, you are not alone, the stock often raises questions about what you are really paying for.
- The share price closed at US$52.55, with returns of a 12.6% decline over 7 days, a 13.0% decline over 30 days, a 9.1% decline year to date, but a 15.4% gain over 1 year, a 34.4% gain over 3 years and a 71.1% decline over 5 years, a mix that can signal shifting views on growth and risk.
- Recent headlines around New Oriental have focused on its evolving position in the education sector and how regulatory changes in prior years continue to influence investor sentiment today. Commentary has also highlighted how the company is reshaping its business model and revenue mix, which helps explain why the stock has moved quite differently across short term and longer time frames.
- On our valuation checks, New Oriental scores 4 out of 6 for potential undervaluation, as shown by its valuation score. Next, we will break down what different valuation approaches say about that number and point you toward an even richer way to think about value at the end of the article.
Approach 1: New Oriental Education & Technology Group Discounted Cash Flow (DCF) Analysis
A Discounted Cash Flow model takes estimated future cash flows, then discounts them back into today’s dollars to arrive at an implied value per share. It is essentially asking what those future cash flows are worth right now.
For New Oriental Education & Technology Group, the model uses a 2 Stage Free Cash Flow to Equity approach. The latest twelve month free cash flow is about $656.4 million, and analysts plus extrapolations project annual free cash flows such as $682.6 million in 2026 and $734.3 million in 2027, with further projections extended out to 2035 by Simply Wall St based on the supplied path of estimates.
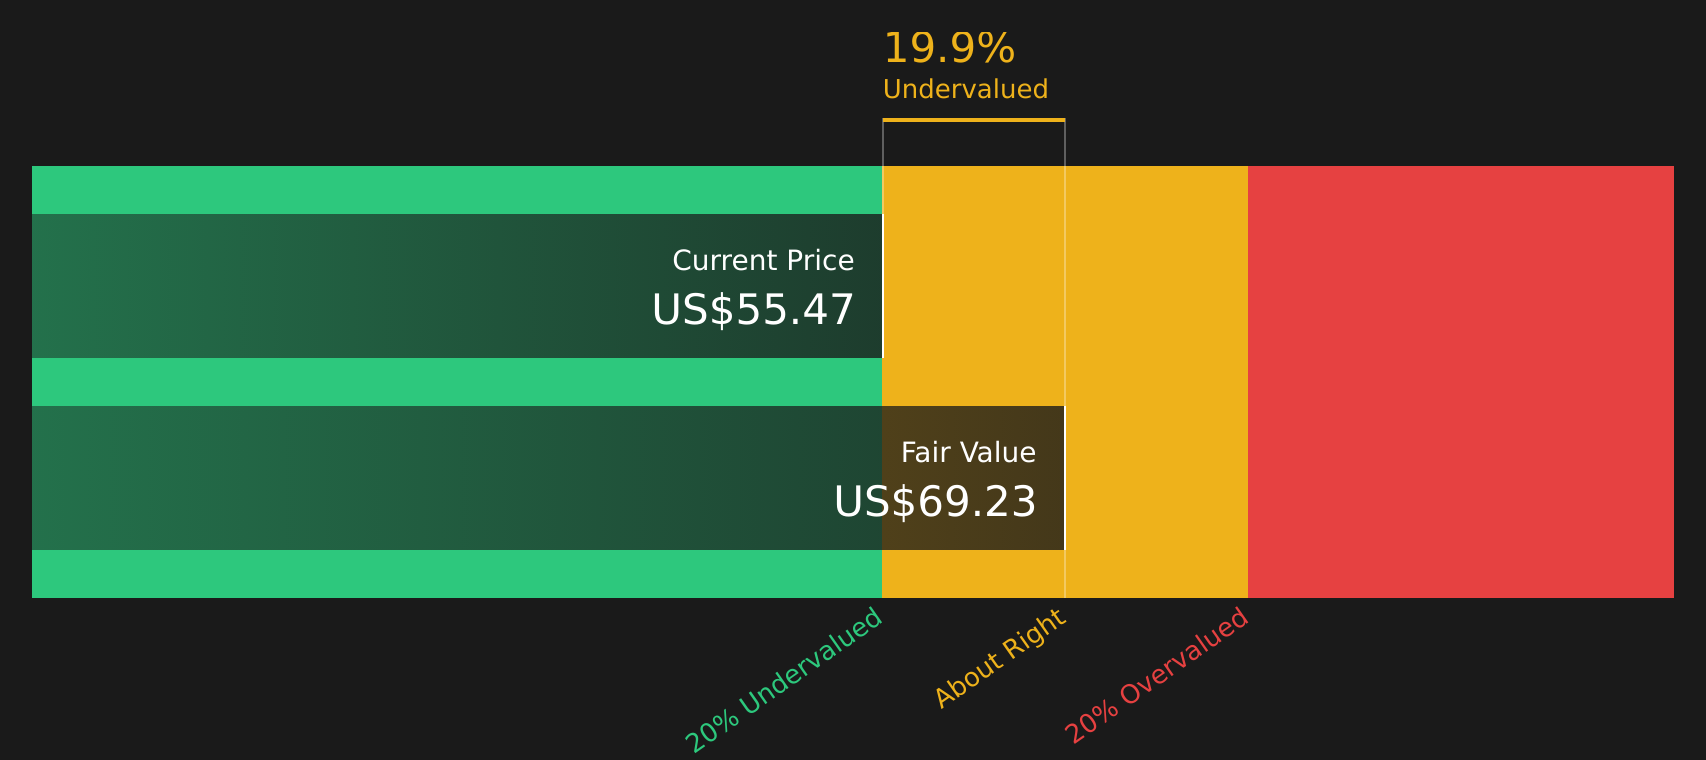
When all those projected cash flows are discounted back, the resulting estimated intrinsic value comes out at about $67.61 per share. Against the recent share price of $52.55, the model implies the stock trades at roughly a 22.3% discount, which indicates potential undervaluation on this specific cash flow view.
Result: UNDERVALUED
Our Discounted Cash Flow (DCF) analysis suggests New Oriental Education & Technology Group is undervalued by 22.3%. Track this in your watchlist or portfolio, or discover 49 more high quality undervalued stocks.
Approach 2: New Oriental Education & Technology Group Price vs Earnings
For a profitable business like New Oriental Education & Technology Group, the P/E ratio is a useful yardstick because it links what you pay per share to the earnings the company is already generating. It helps you see how many dollars of price the market is paying for each dollar of current earnings.
What counts as a “fair” P/E depends on what investors expect for future growth and how much risk they see in those earnings. Higher expected growth and lower perceived risk can justify a higher P/E, while slower growth and higher risk usually point to a lower multiple.
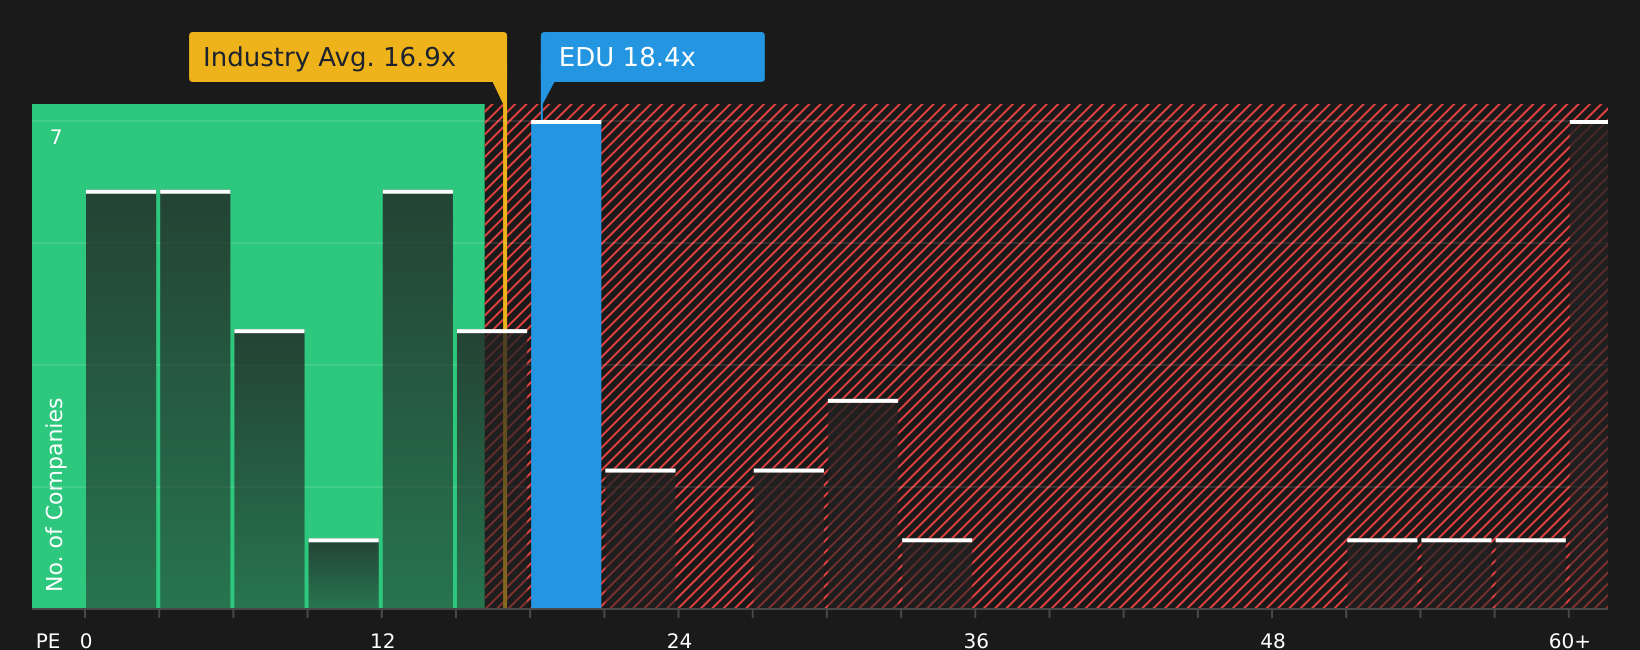
New Oriental currently trades on a P/E of 21.98x, compared with a Consumer Services industry average of about 18.23x and a peer group average of 18.12x. Simply Wall St’s Fair Ratio for New Oriental is 27.39x, which is its proprietary estimate of a P/E that reflects the company’s earnings growth profile, profit margins, risk characteristics, industry and market cap. This Fair Ratio can be more informative than simple peer or industry comparisons because it adjusts for those company specific factors. Since the Fair Ratio sits above the current 21.98x P/E, this framework suggests the shares could be pricing in a lower multiple than those fundamentals might support.
Result: UNDERVALUED
P/E ratios tell one story, but what if the real opportunity lies elsewhere? Start investing in legacies, not executives. Discover our 18 top founder-led companies.
Upgrade Your Decision Making: Choose your New Oriental Education & Technology Group Narrative
Earlier we mentioned that there is an even better way to understand valuation, so let us introduce you to Narratives. These let you spell out your story for New Oriental Education & Technology Group, connect that story to explicit assumptions for future revenue, earnings and margins, and then see a Fair Value that you can compare with today’s share price in an easy visual tool on Simply Wall St’s Community page. This tool updates automatically when fresh news or earnings arrive. One investor might align with the more cautious view that sees Fair Value around US$51.33, while another leans toward a fuller upside case closer to US$80.00. Both can quickly see how their chosen Narrative, not just the raw P/E or DCF output, informs whether the current price looks high, low or roughly in line with their own expectations.
For New Oriental Education & Technology Group, here are previews of two leading New Oriental Education & Technology Group narratives to make comparison easier:
🐂 New Oriental Education & Technology Group Bull Case
Fair value in this bullish narrative: US$64.49 per share
Implied discount to this fair value at the last close of US$52.55: about 18.5% undervalued
Assumed annual revenue growth used in this view: 9.64%
- Focuses on margin expansion and capital returns, with analysts using revenue growth of 9.7% a year over the next 3 years and profit margins rising from 7.6% to 9.7%.
- Assumes earnings reach US$628.5m, or earnings per share of US$4.18, by around September 2028, with the P/E moving down to 16.7x, which is below the current US Consumer Services industry P/E of 18.6x.
- Builds in a 3.68% yearly decline in shares outstanding, a 7.62% discount rate, and analyst consensus price targets that sit above the recent share price. It also flags competition, regulation and execution as key risks to watch.
🐻 New Oriental Education & Technology Group Bear Case
Fair value in this bearish narrative: US$51.33 per share
Implied position versus this fair value at the last close of US$52.55: about 2.4% overvalued
Assumed annual revenue growth used in this view: 8.67%
- Starts from a more cautious stance, using revenue growth of 6.8% a year over the next 3 years and profit margins easing from 7.6% to 7.3% in the core model.
- Builds to earnings of US$434.8m, or earnings per share of US$3.39, by around September 2028 and applies a 16.3x P/E, below the current US Consumer Services industry P/E of 18.6x, to arrive at a bearish price target reference of US$38.90 in the underlying framework.
- Highlights structural and regulatory pressures, competition from EdTech and higher fixed costs as key concerns. It also acknowledges that recent updates have moved this narrative’s fair value to US$51.33 with slightly higher assumed growth, margins and future P/E.
Do you think there's more to the story for New Oriental Education & Technology Group? Head over to our Community to see what others are saying!

This article by Simply Wall St is general in nature. We provide commentary based on historical data and analyst forecasts only using an unbiased methodology and our articles are not intended to be financial advice. It does not constitute a recommendation to buy or sell any stock, and does not take account of your objectives, or your financial situation. We aim to bring you long-term focused analysis driven by fundamental data. Note that our analysis may not factor in the latest price-sensitive company announcements or qualitative material. Simply Wall St has no position in any stocks mentioned.
Have feedback on this article? Concerned about the content? Get in touch with us directly. Alternatively, email editorial-team@simplywallst.com
Contact Us
Contact Number :+852 3852 8500Webull Securities Limited is licensed with the Securities and Futures Commission of Hong Kong (CE No. BNG700) for carrying out Type 1 License for Dealing in Securities, Type 2 License for Dealing in Futures Contracts and Type 4 License for Advising on Securities.

English