
A Look At Nelnet (NNI) Valuation After Full Year 2025 Earnings Draw Fresh Attention
Why Nelnet’s 2025 earnings are drawing fresh attention
Nelnet (NNI) is back on investors’ radar after reporting fourth quarter and full year 2025 results, with annual net income of US$428.47 million and earnings per share of US$11.79 from continuing operations.
See our latest analysis for Nelnet.
The latest results arrive after a steady period for the share price, with a 90 day share price return of 1.61% and a stronger 1 year total shareholder return of 14.89%. This suggests momentum has been building over a longer horizon.
If Nelnet’s earnings news has you reassessing opportunities in financial and tech enabled services, it could be a good time to broaden your search and check out 20 top founder-led companies.
With the share price up 14.89% over the past year and the stock trading only about 6% below one analyst price target, you have to ask: is Nelnet still undervalued, or is the market already pricing in future growth?
Preferred P/E of 11x: Is it justified?
Nelnet shares last closed at $131.81, which puts the stock on a P/E of 11x, higher than both its Consumer Finance industry average of 7.9x and its peer group average of 9.4x.
The P/E multiple compares the current share price to earnings per share and gives a quick sense of how much investors are paying for each dollar of profit. For a diversified financial and education services group like Nelnet, this is a common yardstick because earnings are a key driver of value across loan servicing, education technology and payments, and asset management.
Here, the picture is mixed. On one hand, Nelnet’s P/E of 11x sits below the wider US market average of 18.9x, which indicates the stock is priced more conservatively than many US shares overall. On the other hand, the company appears expensive versus both its Consumer Finance industry average P/E of 7.9x and its closer peer group average of 9.4x. This suggests the market is assigning a premium to its earnings compared to sector peers.
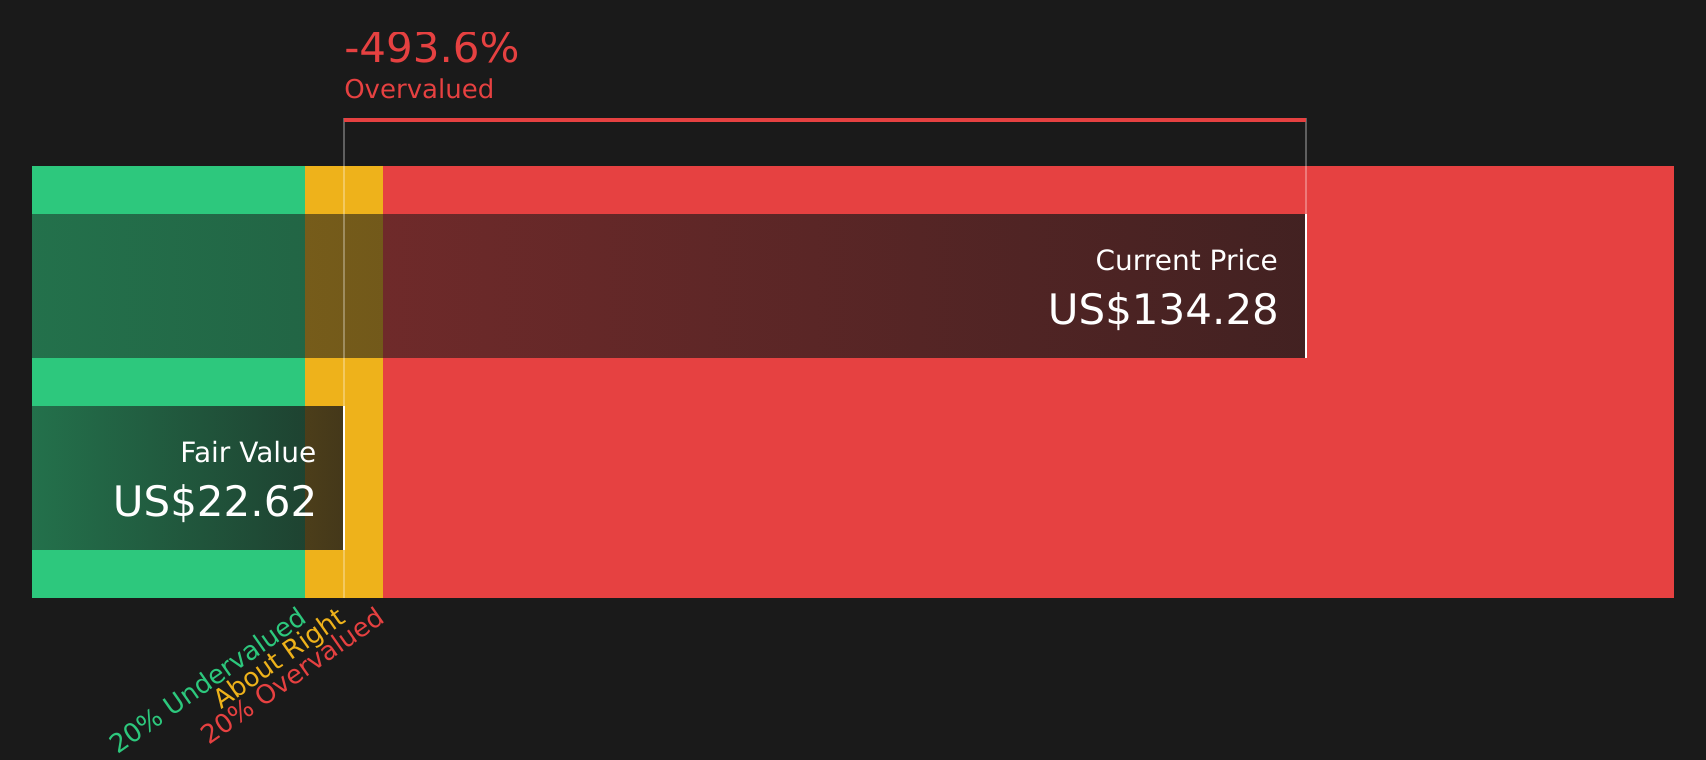
That premium is worth paying attention to because it indicates investors are willing to value Nelnet’s earnings more highly than those of similar companies even though our SWS DCF model currently estimates a future cash flow value of $22.78, well below the current share price of $131.81. If the market ever leans more on cash flow based valuation than earnings based multiples, that gap could become a key factor in how the stock is priced.
See what the numbers say about this price — find out in our valuation breakdown.
Result: Price-to-Earnings of 11x (OVERVALUED)
However, that premium can cut both ways if earnings stall or cash flow expectations fall further, especially with the stock already close to its US$140 price target.
Find out about the key risks to this Nelnet narrative.
Another view on Nelnet’s value
Our SWS DCF model paints a very different picture. It puts Nelnet’s future cash flow value at $22.78 per share, compared with the current $131.81 price, which screens as overvalued on that basis. If earnings are priced for a premium but cash flows are not, which signal matters more to you?
Look into how the SWS DCF model arrives at its fair value.
Simply Wall St performs a discounted cash flow (DCF) on every stock in the world every day (check out Nelnet for example). We show the entire calculation in full. You can track the result in your watchlist or portfolio and be alerted when this changes, or use our stock screener to discover 47 high quality undervalued stocks. If you save a screener we even alert you when new companies match - so you never miss a potential opportunity.
Next Steps
Torn between the risks and rewards you have seen so far? Take a closer look at the numbers and context today, and weigh up 2 key rewards and 2 important warning signs.
Looking for more investment ideas?
If Nelnet has sharpened your focus, do not stop here. The right watchlist can start with one idea, but your next opportunity might sit somewhere completely different.
- Target reliable payers by checking out income opportunities through 14 dividend fortresses and see which companies currently stand out for yield and consistency.
- Zero in on value by scanning 47 high quality undervalued stocks, where you can filter for companies that pair quality fundamentals with conservative pricing.
- Protect your downside by reviewing 63 resilient stocks with low risk scores, helping you focus on businesses with more resilient risk profiles before market sentiment shifts again.
This article by Simply Wall St is general in nature. We provide commentary based on historical data and analyst forecasts only using an unbiased methodology and our articles are not intended to be financial advice. It does not constitute a recommendation to buy or sell any stock, and does not take account of your objectives, or your financial situation. We aim to bring you long-term focused analysis driven by fundamental data. Note that our analysis may not factor in the latest price-sensitive company announcements or qualitative material. Simply Wall St has no position in any stocks mentioned.
Have feedback on this article? Concerned about the content? Get in touch with us directly. Alternatively, email editorial-team@simplywallst.com
Contact Us
Contact Number :+852 3852 8500Webull Securities Limited is licensed with the Securities and Futures Commission of Hong Kong (CE No. BNG700) for carrying out Type 1 License for Dealing in Securities, Type 2 License for Dealing in Futures Contracts and Type 4 License for Advising on Securities.

English