
Has Mohawk Industries (MHK) Become More Attractive After Recent 24% Share Price Slide
- If you are wondering whether Mohawk Industries at around US$102.55 is a potential bargain or a value trap, you are not alone.
- The stock has seen a 24.0% decline over the last 30 days and is down 10.3% over the past year, even though the 3 year return sits at 8.7%.
- Recent headlines have focused on Mohawk Industries' position in the flooring and broader consumer durables market, including how it is responding to shifts in housing activity and renovation demand. This context has kept attention on the stock as investors reassess the balance between cyclicality, cost pressures and long term demand for its products.
- Our Simply Wall St valuation checks give Mohawk Industries a 5/6 value score. This raises an obvious question: how do different valuation methods stack up for this stock, and is there an even better way to think about its value that we will come back to at the end?
Find out why Mohawk Industries's -10.3% return over the last year is lagging behind its peers.
Approach 1: Mohawk Industries Discounted Cash Flow (DCF) Analysis
A Discounted Cash Flow, or DCF, model projects a company’s future cash flows and then discounts them back to today’s dollars to estimate what the whole business could be worth right now.
For Mohawk Industries, the model used is a 2 Stage Free Cash Flow to Equity approach based on cash flow projections. The company’s last twelve month free cash flow is about $559.9 million. Analyst inputs and Simply Wall St extrapolations point to free cash flow of $712.1 million in 2035, with intermediate years such as 2026 and 2028 projected at $601.5 million and $655.0 million respectively, all in USD and all below $1 billion.
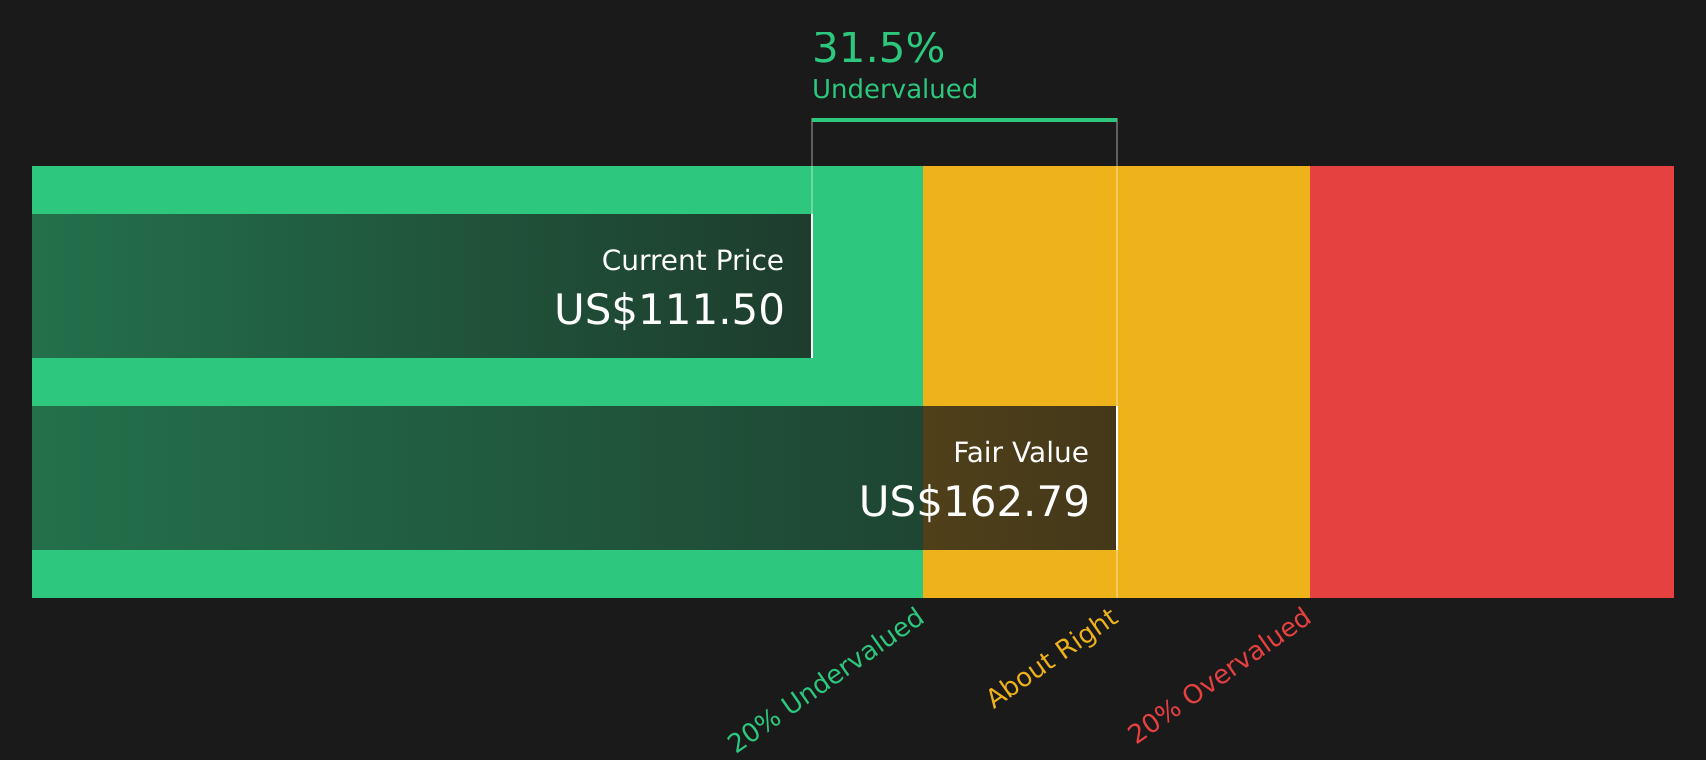
When those projected cash flows are discounted back, the DCF model suggests an estimated intrinsic value of about $151.83 per share, compared with the recent share price of roughly $102.55. That implies the stock is trading at a 32.5% discount to this DCF estimate, indicating potential undervaluation on this model alone.
Result: UNDERVALUED
Our Discounted Cash Flow (DCF) analysis suggests Mohawk Industries is undervalued by 32.5%. Track this in your watchlist or portfolio, or discover 48 more high quality undervalued stocks.
Approach 2: Mohawk Industries Price vs Earnings
For a profitable company like Mohawk Industries, the P/E ratio is a useful shorthand for how much investors are paying for each dollar of earnings. It ties directly to what the business currently earns, which is often easier to interpret than cash flow models on their own.
What counts as a “normal” P/E depends on how quickly earnings are expected to grow and how risky those earnings appear. Higher expected growth or lower perceived risk can justify a higher P/E, while slower growth or higher risk usually calls for a lower one.
Mohawk Industries currently trades on a P/E of 17.0x. That sits above the Consumer Durables industry average of about 11.4x, but below the peer group average of 19.3x. Simply Wall St’s Fair Ratio for Mohawk Industries is 25.8x, which is its proprietary estimate of what the P/E could be given factors such as earnings growth, profit margin, industry, market cap and company specific risks.
This Fair Ratio is more tailored than a simple comparison with peers or the broad industry, because it adjusts for the company’s own fundamentals rather than assuming all firms deserve similar multiples. With the current P/E of 17.0x sitting below the 25.8x Fair Ratio, Mohawk Industries screens as undervalued on this measure.
Result: UNDERVALUED

P/E ratios tell one story, but what if the real opportunity lies elsewhere? Start investing in legacies, not executives. Discover our 18 top founder-led companies.
Upgrade Your Decision Making: Choose your Mohawk Industries Narrative
Earlier we mentioned that there is an even better way to think about valuation. On Simply Wall St’s Community page you can use Narratives to connect your own story about Mohawk Industries to a set of numbers by setting assumptions for future revenue, earnings and margins. This is then turned into a fair value, which you can compare with the current price to see whether your view points you toward buying or selling. Because Narratives update automatically when new information such as Mohawk’s latest Q4 results, analyst price targets between US$120 and US$150 or fair value estimates like US$144 arrive, you can easily see how a more optimistic view that leans toward the upper end of that range or a more cautious view closer to the lower end leads to different fair values and decisions, all within a simple, accessible tool used by millions of investors.
Do you think there's more to the story for Mohawk Industries? Head over to our Community to see what others are saying!

This article by Simply Wall St is general in nature. We provide commentary based on historical data and analyst forecasts only using an unbiased methodology and our articles are not intended to be financial advice. It does not constitute a recommendation to buy or sell any stock, and does not take account of your objectives, or your financial situation. We aim to bring you long-term focused analysis driven by fundamental data. Note that our analysis may not factor in the latest price-sensitive company announcements or qualitative material. Simply Wall St has no position in any stocks mentioned.
Have feedback on this article? Concerned about the content? Get in touch with us directly. Alternatively, email editorial-team@simplywallst.com
Contact Us
Contact Number :+852 3852 8500Webull Securities Limited is licensed with the Securities and Futures Commission of Hong Kong (CE No. BNG700) for carrying out Type 1 License for Dealing in Securities, Type 2 License for Dealing in Futures Contracts and Type 4 License for Advising on Securities.

English