
High Growth Tech Stocks To Watch In The US Market
Over the last 7 days, the United States market has dropped 2.3%, but it has experienced a 13% rise over the past year, with earnings forecast to grow by 16% annually. In this context, identifying high growth tech stocks involves looking for companies that demonstrate strong innovation and adaptability in an evolving market landscape.
Top 10 High Growth Tech Companies In The United States
| Name | Revenue Growth | Earnings Growth | Growth Rating |
|---|---|---|---|
| Marker Therapeutics | 61.33% | 65.71% | ★★★★★★ |
| Palantir Technologies | 27.02% | 31.25% | ★★★★★★ |
| 22.20% | 27.96% | ★★★★★★ | |
| Sandisk | 30.23% | 46.19% | ★★★★★★ |
| Gorilla Technology Group | 54.35% | 95.02% | ★★★★★☆ |
| Ondas | 35.55% | 69.51% | ★★★★★☆ |
| Zscaler | 15.90% | 48.88% | ★★★★★☆ |
| Duos Technologies Group | 53.76% | 155.11% | ★★★★★☆ |
| Procore Technologies | 12.08% | 99.98% | ★★★★★☆ |
| KVH Industries | 25.44% | 135.75% | ★★★★★☆ |
Click here to see the full list of 73 stocks from our US High Growth Tech and AI Stocks screener.
We'll examine a selection from our screener results.
Flex (FLEX)
Simply Wall St Growth Rating: ★★★★☆☆
Overview: Flex Ltd. offers technology innovation, supply chain, and manufacturing solutions across various industries including data center, communications, enterprise, consumer, automotive, industrial, healthcare, and power sectors with a market capitalization of approximately $23.91 billion.
Operations: Flex Ltd. generates revenue primarily through its Flex Agility Solutions (FAS) and Flex Reliability Solutions (FRS) segments, with FAS contributing $14.78 billion and FRS $12.06 billion.
Flex's recent strategic moves, particularly in AI infrastructure, underscore its adaptability and foresight in the high-growth tech sector. The company's collaboration with NVIDIA to develop the 800 VDC Power Rack—a cornerstone of Flex’s AI Infrastructure Platform—demonstrates innovation aimed at meeting the escalating demands of giga-scale AI deployments. This initiative not only enhances system performance by integrating advanced cooling systems and high-density racks but also promises up to 30% faster deployment through pre-engineered modular designs. Additionally, Flex's expansion with AMD to manufacture the AMD Instinct platform in Texas reflects a strategic alignment with domestic production trends, potentially bolstering its market stance amid growing calls for localized manufacturing chains. These developments are pivotal as Flex navigates a competitive landscape where annual earnings are expected to grow by 21.7%, despite a more modest revenue growth forecast of 6.2% per year.

TTM Technologies (TTMI)
Simply Wall St Growth Rating: ★★★★☆☆
Overview: TTM Technologies, Inc. is a company that manufactures and sells mission systems, RF components, RF microwave/microelectronic assemblies, and printed circuit boards (PCBs) and substrates globally, with a market cap of approximately $10.53 billion.
Operations: TTM Technologies generates revenue primarily from its Commercial and Aerospace & Defense segments, contributing approximately $1.59 billion and $1.29 billion respectively. The company also earns from RF&S Components, adding around $40 million to its revenue stream.
TTM Technologies has demonstrated robust growth, with a notable 214.4% increase in earnings over the past year, significantly outpacing the electronic industry's 17.4%. This growth is underpinned by strategic initiatives like the recent multi-year $200 million agreement with Raytheon for advanced electronic components, which not only bolsters its revenue streams but also solidifies its position in defense technology. Moreover, TTM's commitment to innovation is evident from its R&D expenses which have strategically fueled these advancements. Looking ahead, TTM anticipates a revenue increase of 15-20% for fiscal 2026, reflecting both market confidence and operational efficiency.
- Click to explore a detailed breakdown of our findings in TTM Technologies' health report.
Evaluate TTM Technologies' historical performance by accessing our past performance report.

Fabrinet (FN)
Simply Wall St Growth Rating: ★★★★★☆
Overview: Fabrinet offers optical packaging and precision optical, electro-mechanical, and electronic manufacturing services across North America, the Asia-Pacific, and Europe, with a market capitalization of $19.58 billion.
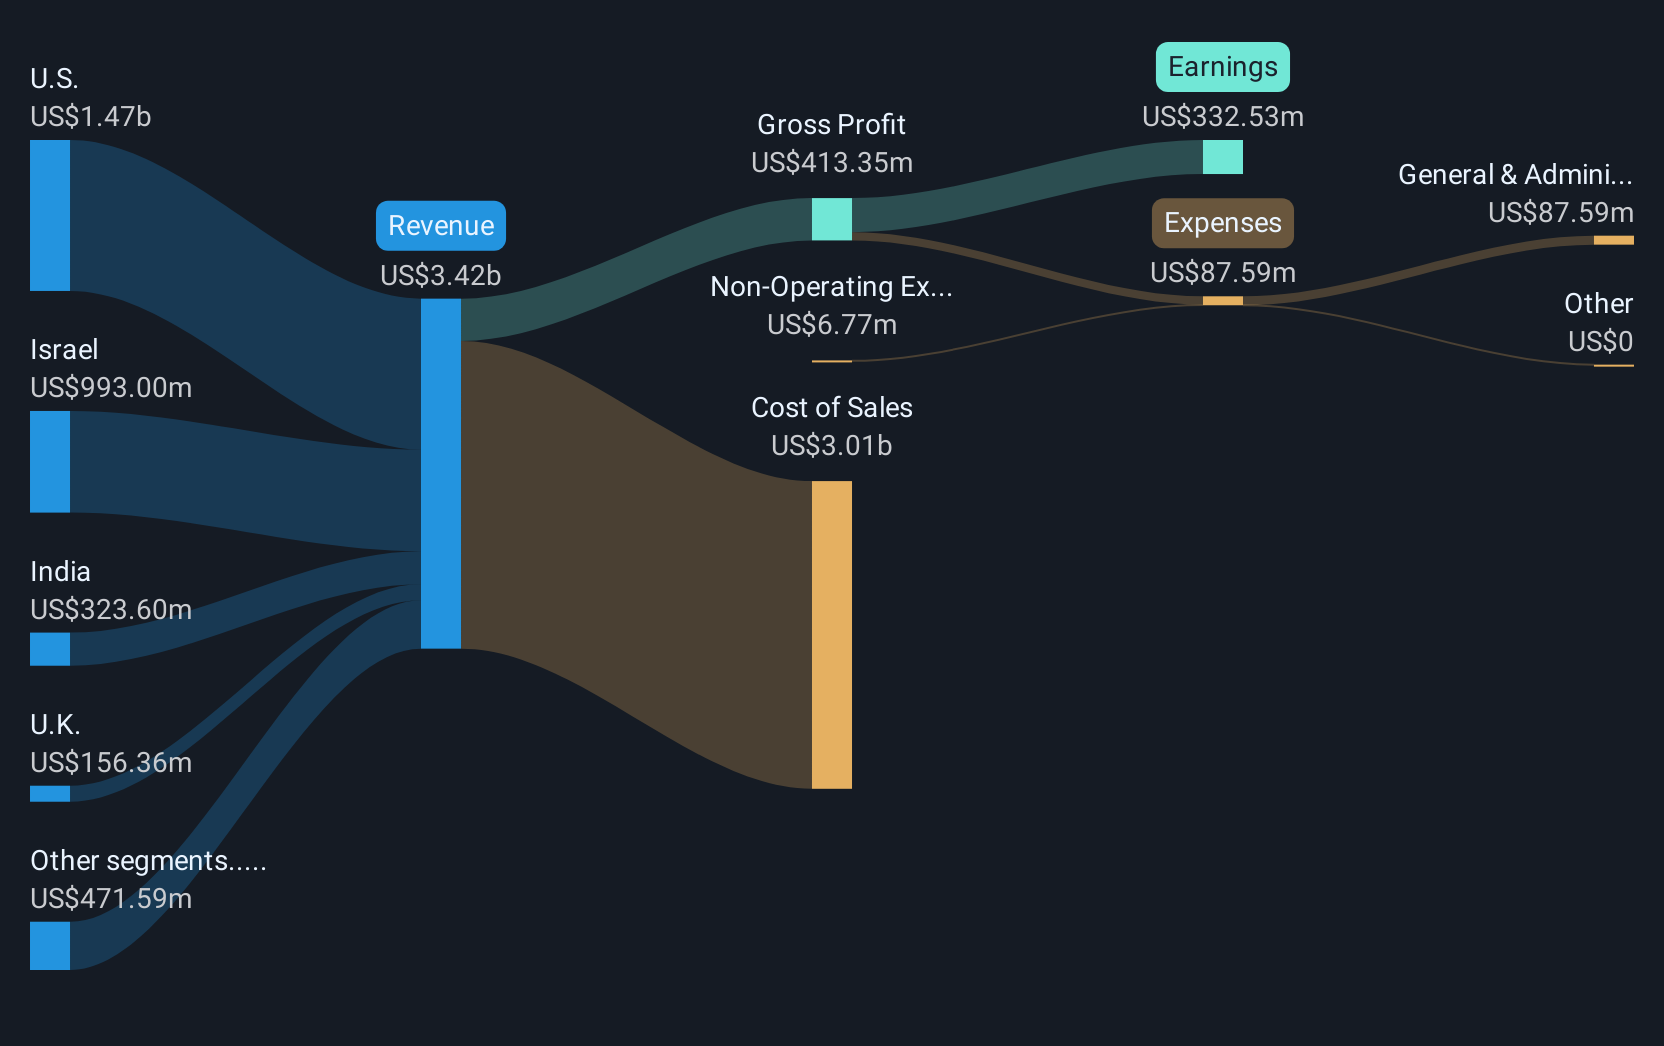
Operations: The company generates revenue primarily from its Optical Networking Equipment segment, which accounts for $3.89 billion.
Fabrinet has shown a promising trajectory in the high-growth tech sector, with recent financials underscoring its robust performance. In the second quarter of fiscal 2026, it reported a significant increase in sales to $1.13 billion from $833.61 million year-over-year and net income surged to $112.63 million from $86.64 million, reflecting an earnings growth of 20.3% annually over the past five years. The company's forward-looking stance is evident as they project third-quarter revenues between $1.15 billion and $1.20 billion, suggesting sustained growth momentum backed by strategic R&D investments which have consistently aligned with revenue increases, maintaining a healthy balance that fuels innovation while driving profitability.
- Click here and access our complete health analysis report to understand the dynamics of Fabrinet.
Gain insights into Fabrinet's past trends and performance with our Past report.
Key Takeaways
- Take a closer look at our US High Growth Tech and AI Stocks list of 73 companies by clicking here.
- Got skin in the game with these stocks? Elevate how you manage them by using Simply Wall St's portfolio, where intuitive tools await to help optimize your investment outcomes.
- Simply Wall St is your key to unlocking global market trends, a free user-friendly app for forward-thinking investors.
Looking For Alternative Opportunities?
- Explore high-performing small cap companies that haven't yet garnered significant analyst attention.
- Fuel your portfolio with companies showing strong growth potential, backed by optimistic outlooks both from analysts and management.
- Find companies with promising cash flow potential yet trading below their fair value.
This article by Simply Wall St is general in nature. We provide commentary based on historical data and analyst forecasts only using an unbiased methodology and our articles are not intended to be financial advice. It does not constitute a recommendation to buy or sell any stock, and does not take account of your objectives, or your financial situation. We aim to bring you long-term focused analysis driven by fundamental data. Note that our analysis may not factor in the latest price-sensitive company announcements or qualitative material. Simply Wall St has no position in any stocks mentioned.
Have feedback on this article? Concerned about the content? Get in touch with us directly. Alternatively, email editorial-team@simplywallst.com
Contact Us
Contact Number :+852 3852 8500Webull Securities Limited is licensed with the Securities and Futures Commission of Hong Kong (CE No. BNG700) for carrying out Type 1 License for Dealing in Securities, Type 2 License for Dealing in Futures Contracts and Type 4 License for Advising on Securities.

English