
A Look At Monte Rosa Therapeutics (GLUE) Valuation After Johnson & Johnson MRT-2359 Trial Supply Agreement
Monte Rosa Therapeutics (GLUE) has moved into focus after signing a supply agreement with Johnson & Johnson to evaluate MRT-2359 plus ERLEADA in a planned Phase 2 trial for metastatic castration-resistant prostate cancer.
See our latest analysis for Monte Rosa Therapeutics.
Alongside the Johnson & Johnson supply agreement and fresh MRT-2359 data, Monte Rosa’s share price has eased recently. The stock has a 30 day share price return of 15% and a 90 day share price return decline of 11%. At the same time, the 1 year total shareholder return of about 3x and 3 year total shareholder return of roughly 2x point to earlier enthusiasm that is now being reassessed as new trial and financing updates come through.
If this kind of biotech catalyst has your attention, it could be worth widening your watchlist to other precision medicine names using the Simply Wall St screener for 34 healthcare AI stocks
With Monte Rosa trading at US$15.38 and an analyst target of US$32.33, plus an indicated intrinsic discount of about 68%, the key question is whether the recent pullback signals an opportunity or if the market already reflects future growth.
Price-to-Sales of 10x: Is it justified?
Monte Rosa trades on a P/S of about 10x, which lines up closely with the US biotech industry average of 10.8x but sits far above its own estimated fair P/S of 1.3x.
The P/S multiple compares the company’s market value with its revenue. This can be useful for early-stage or unprofitable biotech names where earnings are still negative. With Monte Rosa reporting revenue of about $123.7m and a net loss of $38.6m, investors appear to be focusing more on future potential than current profitability.
However, the gap between the current 10x P/S and the estimated fair P/S of 1.3x is wide. This suggests the market price builds in expectations that exceed what the fair ratio model implies. If sentiment or assumptions around revenue growth and commercialization prospects cool, that gap is one area where valuation could compress toward the level the fair ratio signals.
Explore the SWS fair ratio for Monte Rosa Therapeutics
Result: Price-to-sales of 10x (OVERVALUED)
However, investors also need to weigh the ongoing net loss of US$38.6m and recent share price declines, which could signal sensitivity to future trial or funding news.
Find out about the key risks to this Monte Rosa Therapeutics narrative.
Another View: DCF Points the Other Way
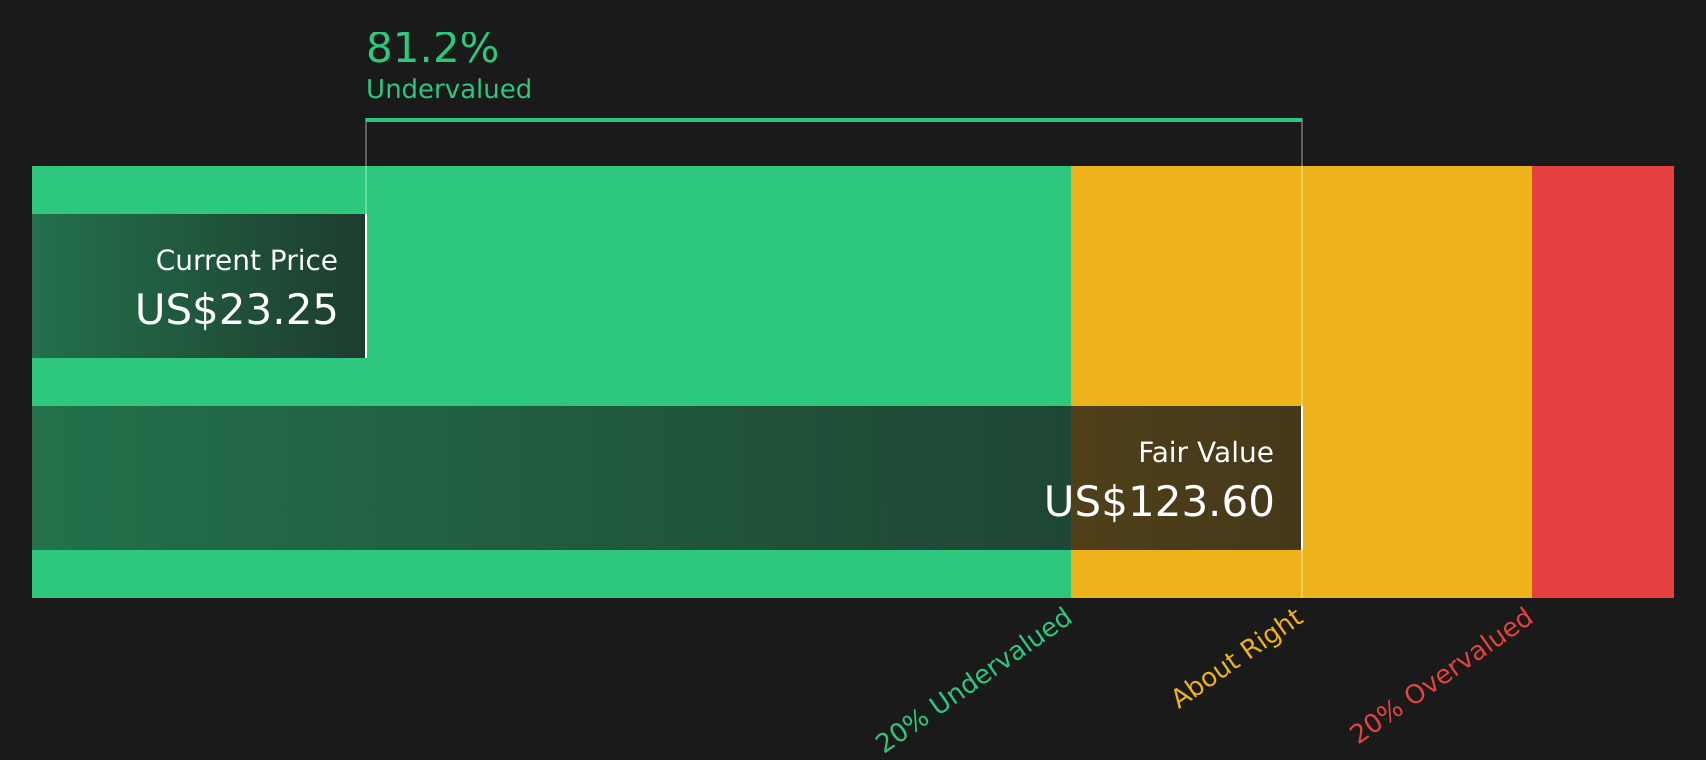
If the 10x P/S ratio suggests Monte Rosa is expensive, the SWS DCF model sends a very different signal. With the shares at $15.38 and the model’s future cash flow value at $48.17, the stock screens as undervalued on this method. Which lens do you trust more when the signals clash?
Look into how the SWS DCF model arrives at its fair value.
Simply Wall St performs a discounted cash flow (DCF) on every stock in the world every day (check out Monte Rosa Therapeutics for example). We show the entire calculation in full. You can track the result in your watchlist or portfolio and be alerted when this changes, or use our stock screener to discover 61 high quality undervalued stocks. If you save a screener we even alert you when new companies match - so you never miss a potential opportunity.
Next Steps
Mixed signals so far, with strong potential set against clear risks, mean this story is still wide open. Move quickly, review the underlying data, and weigh the 3 key rewards and 5 important warning signs.
Looking for more investment ideas?
If Monte Rosa is on your radar, do not leave it there alone. Use focused stock lists to spot other opportunities that could fit your style and goals.
- Hunt for potential value gaps by reviewing companies that pass the 61 high quality undervalued stocks and see which names stand out on your watchlist.
- Prioritise resilience by checking stocks highlighted in the 67 resilient stocks with low risk scores and focus on businesses with lower overall risk profiles.
- Target quality with strong fundamentals through the solid balance sheet and fundamentals stocks screener (39 results) and build a shortlist that looks sturdier across market cycles.
This article by Simply Wall St is general in nature. We provide commentary based on historical data and analyst forecasts only using an unbiased methodology and our articles are not intended to be financial advice. It does not constitute a recommendation to buy or sell any stock, and does not take account of your objectives, or your financial situation. We aim to bring you long-term focused analysis driven by fundamental data. Note that our analysis may not factor in the latest price-sensitive company announcements or qualitative material. Simply Wall St has no position in any stocks mentioned.
Have feedback on this article? Concerned about the content? Get in touch with us directly. Alternatively, email editorial-team@simplywallst.com
Contact Us
Contact Number :+852 3852 8500Webull Securities Limited is licensed with the Securities and Futures Commission of Hong Kong (CE No. BNG700) for carrying out Type 1 License for Dealing in Securities, Type 2 License for Dealing in Futures Contracts and Type 4 License for Advising on Securities.

English