
Assessing Nelnet (NNI) Valuation As Shares Trade On A Premium P/E Multiple
Nelnet (NNI) shares recently closed at $129.09, prompting investors to reassess the education focused financial services group’s mix of loan servicing, education technology, payments, and banking alongside its current return profile.
See our latest analysis for Nelnet.
The recent 2.01% one-day share price return sits against a flat year-to-date move but a 17.52% one-year total shareholder return, suggesting longer term holders have experienced steadier momentum than short term traders.
If Nelnet has sharpened your interest in financial services and technology, this is a good moment to see what else is out there with the 20 top founder-led companies
With a one year total return of 17.5%, annual revenue growth of 3.3%, and shares trading close to analyst targets, the key question is whether Nelnet is still mispriced or if the market already reflects its future growth potential.
Price-to-Earnings of 10.8x: Is it justified?
On a P/E of 10.8x at a share price of $129.09, Nelnet trades at a higher earnings multiple than both the wider US market and its Consumer Finance peers, suggesting investors are paying a premium compared to similar companies.
The P/E ratio tells you how much investors are paying today for each dollar of current earnings. For a diversified financial services group like Nelnet, which combines loan servicing, education technology, payments, asset management, and banking, this measure helps you compare what the market is willing to pay for its earnings against other listed financial stocks.
Here, the market multiple sits below the US market P/E of 18.2x, yet above both the peer group average of 8.7x and the US Consumer Finance industry average of 7.7x. That mix points to a company that is cheaper than the broader market on earnings, but carries a clear earnings premium over closer peers. This may reflect its diversified model, recent earnings growth and margin profile, or simply a stronger recent share price run.
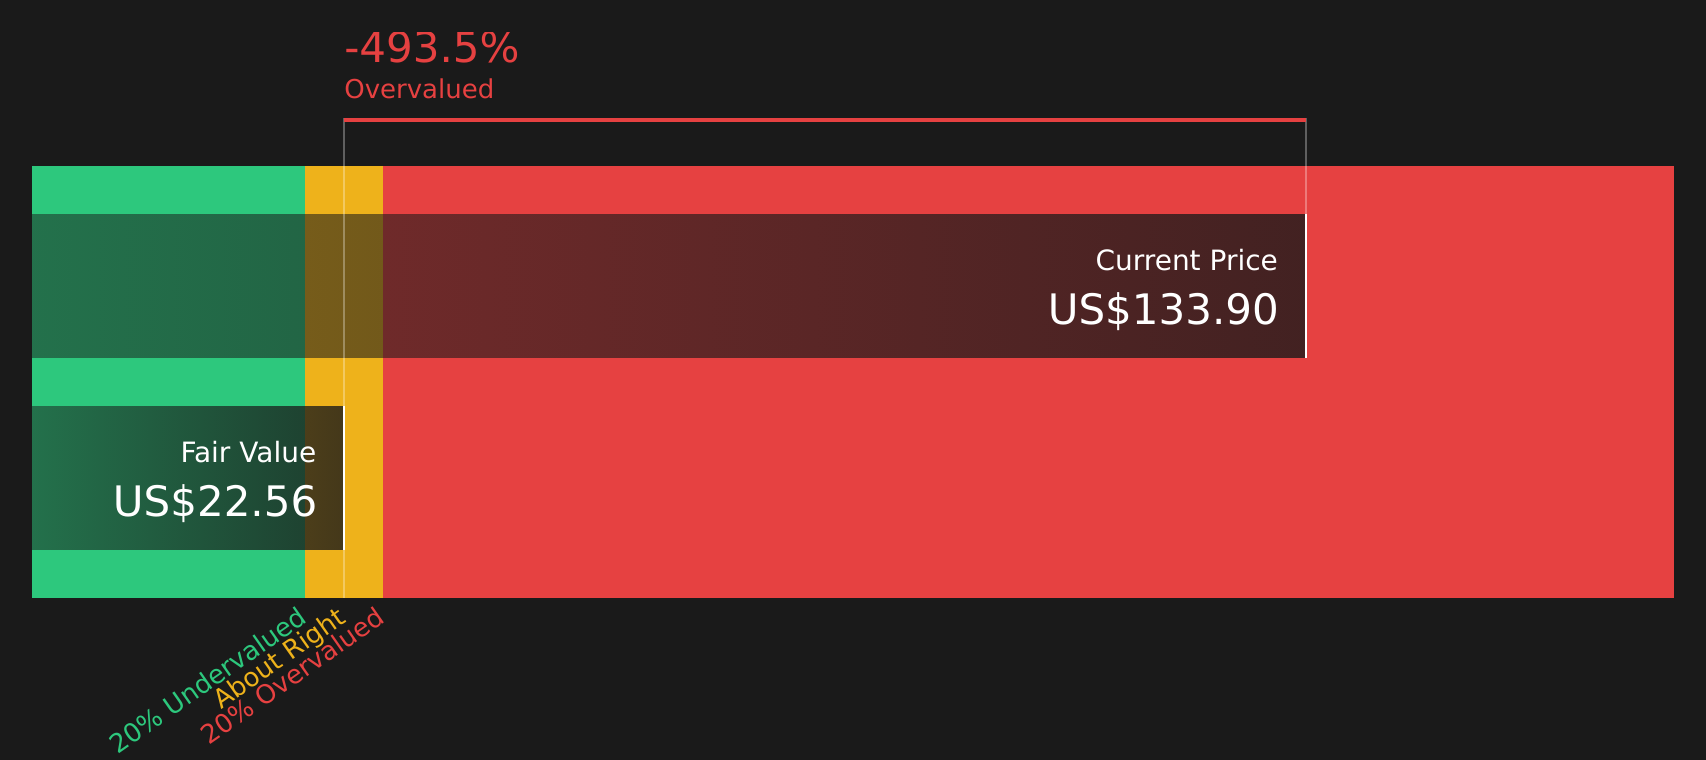
Against that backdrop, the SWS DCF model presents a different picture, with an estimated future cash flow value of $22.85 compared to the current $129.09 share price. This implies the shares trade well above that cash flow based estimate.
Look into how the SWS DCF model arrives at its fair value.
Result: Price-to-Earnings of 10.8x (OVERVALUED)
However, that premium P/E and the gap to the SWS DCF estimate could leave the share price exposed if sector sentiment weakens or if earnings expectations reset.
Find out about the key risks to this Nelnet narrative.
Another View: Cash Flows Paint a Harsher Picture
While the 10.8x P/E might not look stretched at first glance, the SWS DCF model points in a very different direction. It indicates an estimated future cash flow value of $22.85 compared with a $129.09 share price. That gap suggests limited room for error if sentiment or cash generation shifts.
Look into how the SWS DCF model arrives at its fair value.
Simply Wall St performs a discounted cash flow (DCF) on every stock in the world every day (check out Nelnet for example). We show the entire calculation in full. You can track the result in your watchlist or portfolio and be alerted when this changes, or use our stock screener to discover 62 high quality undervalued stocks. If you save a screener we even alert you when new companies match - so you never miss a potential opportunity.
Next Steps
If this mix of risks and rewards feels finely balanced, now is the time to look through the numbers yourself, test the narrative against your own expectations, and then weigh up the 2 key rewards and 2 important warning signs
Looking for more investment ideas?
If you stop with just one stock, you risk missing other opportunities that fit your style, so use curated screeners to widen your field of candidates confidently.
- Target income potential with companies that currently offer stronger yields by reviewing the 12 dividend fortresses
- Hunt for quality at a reasonable price by scanning the 62 high quality undervalued stocks
- Prioritise peace of mind by focusing on the 62 resilient stocks with low risk scores
This article by Simply Wall St is general in nature. We provide commentary based on historical data and analyst forecasts only using an unbiased methodology and our articles are not intended to be financial advice. It does not constitute a recommendation to buy or sell any stock, and does not take account of your objectives, or your financial situation. We aim to bring you long-term focused analysis driven by fundamental data. Note that our analysis may not factor in the latest price-sensitive company announcements or qualitative material. Simply Wall St has no position in any stocks mentioned.
Have feedback on this article? Concerned about the content? Get in touch with us directly. Alternatively, email editorial-team@simplywallst.com
Contact Us
Contact Number :+852 3852 8500Webull Securities Limited is licensed with the Securities and Futures Commission of Hong Kong (CE No. BNG700) for carrying out Type 1 License for Dealing in Securities, Type 2 License for Dealing in Futures Contracts and Type 4 License for Advising on Securities.

English