
StoneX Group (SNEX) Valuation Check After Expanding Cross Border Payments And Banknotes Operations
StoneX Group (SNEX) has been active in building out its financial institution offerings, pairing a new cross-border payments partnership with The Pathfinder Group and acquiring WCS International’s wholesale banknotes business to broaden its global money-movement footprint.
See our latest analysis for StoneX Group.
These payments and banknotes moves come as StoneX Group’s share price sits at US$80.76, with a 7 day share price return of 6.61% and a 30 day share price return of 7.28%. Its 1 year total shareholder return of 53.71% and 5 year total shareholder return of 317.40% indicate momentum that has been strong over a longer period.
If you are looking beyond StoneX Group and want more ideas in a similar corner of the market, this is a good moment to scan 20 cryptocurrency and blockchain stocks
With StoneX Group trading at US$80.76 and carrying a value score of 1 alongside a discount of about 14% to an analyst price target of US$92, is this a mispriced compounder or is the market already baking in future growth?
Price-to-Earnings of 18.3x: Is it justified?
StoneX Group trades on a P/E of 18.3x at a share price of $80.76, which sits slightly below the broader US market but above its direct peer average.
The P/E ratio compares the current share price with earnings per share, so it reflects how much investors are paying for each dollar of current earnings. For a diversified financial services group with multiple business lines across commercial, institutional, retail and payments, this can act as a quick pulse check on how earnings quality and growth expectations are being priced.
Here, the picture is mixed. On one hand, StoneX Group is described as having high quality earnings and has grown earnings by 15.5% per year over the past 5 years, with 30% earnings growth over the past year and earnings forecast to grow around 10.24% per year. On the other hand, its current P/E of 18.3x is described as expensive versus peers on 16.2x and also above an estimated fair P/E of 13.7x, which suggests the current valuation could be ahead of the level that regression based fair value work points to.
Compared with the broader US Capital Markets industry, StoneX Group screens differently again, with its 18.3x P/E described as good value against an industry average of 33.1x. That keeps the company on a lower multiple than many sector names, even though its earnings growth in the last year has outpaced the industry figure of 19.3%. If the P/E were to move closer to the estimated fair P/E of 13.7x, that would imply a material reset in how the market prices its earnings profile.
Explore the SWS fair ratio for StoneX Group
Result: Price-to-Earnings of 18.3x (OVERVALUED)
However, there are clear risks if earnings growth slows, or if the 14% discount to the US$92 analyst target narrows without stronger fundamentals to support the higher P/E.
Find out about the key risks to this StoneX Group narrative.
Another view: DCF sends a very different signal
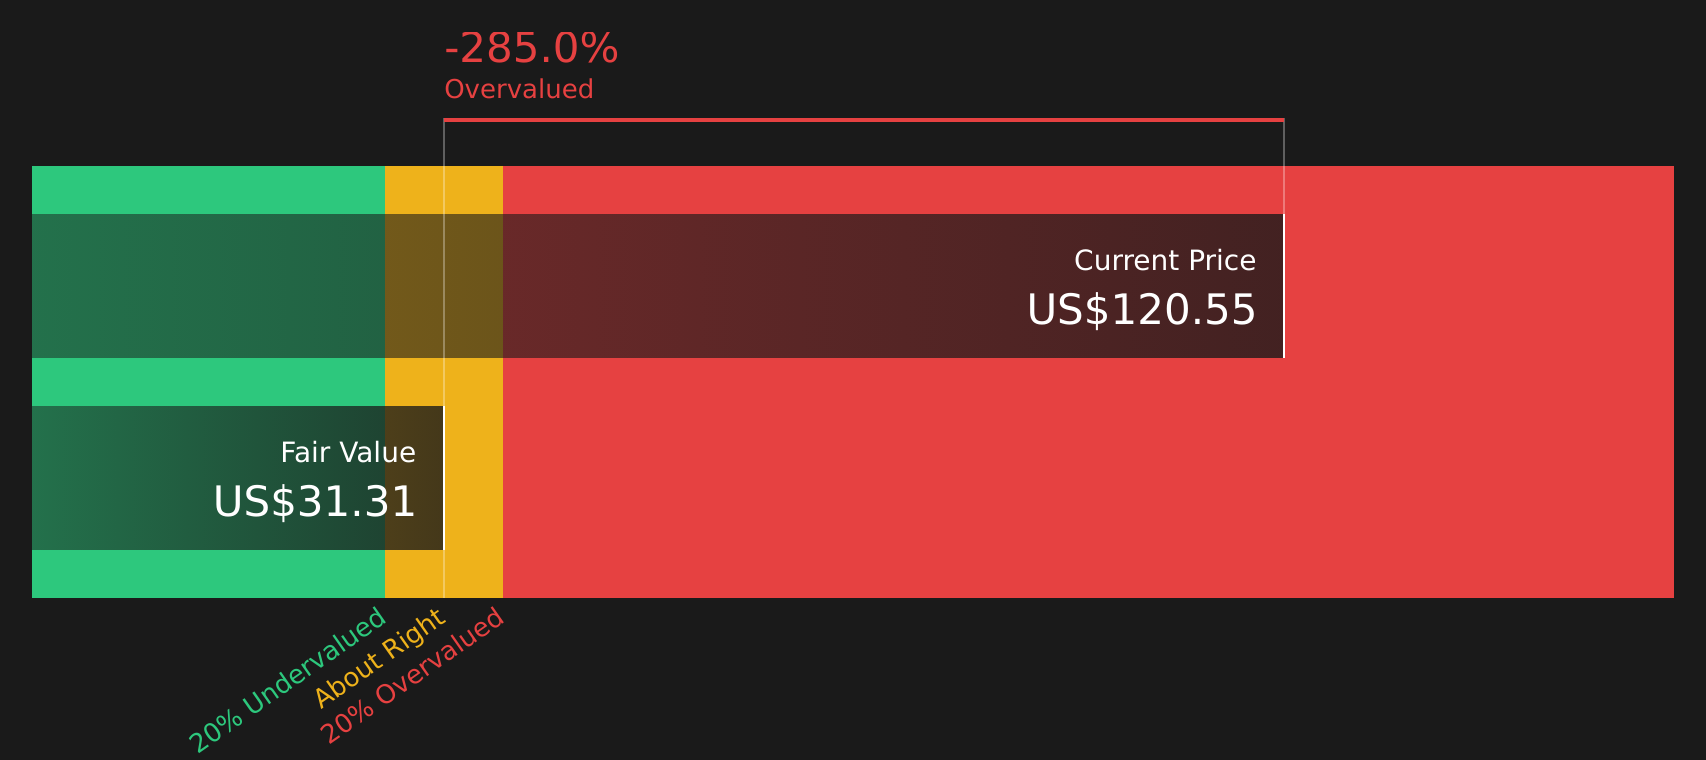
While the P/E of 18.3x paints StoneX Group as slightly expensive against peers yet cheaper than the wider industry, the SWS DCF model lands in a very different place. At a share price of $80.76 versus an estimated future cash flow value of $29.44, the stock screens as overvalued on this method. That is a wide gap for you to weigh, especially if you lean more on cash flow based valuation.
Look into how the SWS DCF model arrives at its fair value.
Simply Wall St performs a discounted cash flow (DCF) on every stock in the world every day (check out StoneX Group for example). We show the entire calculation in full. You can track the result in your watchlist or portfolio and be alerted when this changes, or use our stock screener to discover 63 high quality undervalued stocks. If you save a screener we even alert you when new companies match - so you never miss a potential opportunity.
Next Steps
With mixed signals from P/E and DCF in mind, do not wait for the market to make the call for you; weigh the trade off between current pricing, growth assumptions and cash flow estimates, then check the 3 key rewards
Looking for more investment ideas?
If you stop at one stock, you miss the bigger picture; broaden your watchlist now and give yourself more chances to find ideas that truly fit your approach.
- Target dependable income by scanning 12 dividend fortresses that may help anchor your portfolio when sentiment shifts.
- Hunt for quality at a discount with 63 high quality undervalued stocks that pair stronger fundamentals with pricing that could appeal to value focused investors.
- Prioritise resilience by checking 65 resilient stocks with low risk scores that screen well on financial strength and risk metrics.
This article by Simply Wall St is general in nature. We provide commentary based on historical data and analyst forecasts only using an unbiased methodology and our articles are not intended to be financial advice. It does not constitute a recommendation to buy or sell any stock, and does not take account of your objectives, or your financial situation. We aim to bring you long-term focused analysis driven by fundamental data. Note that our analysis may not factor in the latest price-sensitive company announcements or qualitative material. Simply Wall St has no position in any stocks mentioned.
Have feedback on this article? Concerned about the content? Get in touch with us directly. Alternatively, email editorial-team@simplywallst.com
Contact Us
Contact Number :+852 3852 8500Webull Securities Limited is licensed with the Securities and Futures Commission of Hong Kong (CE No. BNG700) for carrying out Type 1 License for Dealing in Securities, Type 2 License for Dealing in Futures Contracts and Type 4 License for Advising on Securities.

English