
Is It Time To Reassess Cadence Design Systems (CDNS) After Recent Share Price Weakness?
- Investors may be considering whether Cadence Design Systems at around US$280 per share still aligns with its underlying worth, or if expectations have run ahead of reality.
- The stock closed at US$280.19, with returns of a 0.4% decline over 7 days, 7.6% decline over 30 days, 9.7% decline year to date, 5.8% gain over 1 year, 35.0% gain over 3 years and 96.5% gain over 5 years. This presents a mixed picture of recent and longer-term performance.
- Recent news coverage has focused on Cadence Design Systems as a key software supplier in electronic design automation and as a widely followed name in the semiconductor ecosystem. These themes often influence investor expectations and risk appetite, and this context helps frame how sentiment around the stock can shift even without company-specific announcements driving every move.
- On Simply Wall St's valuation checks, Cadence Design Systems currently scores 1 out of 6. The next step is to compare what different valuation approaches indicate about the stock today, followed by a more rounded way to think about valuation at the end of this article.
Cadence Design Systems scores just 1/6 on our valuation checks. See what other red flags we found in the full valuation breakdown.
Approach 1: Cadence Design Systems Discounted Cash Flow (DCF) Analysis
A Discounted Cash Flow model estimates what a company could be worth by projecting its future cash flows and discounting them back to today. For Cadence Design Systems, the model here uses a 2 Stage Free Cash Flow to Equity approach based on cash flow projections in $.
The latest twelve month free cash flow is about $1.59b. Analyst based projections in the DCF extend out to 2028, with free cash flow for that year modeled at around $2.54b. Beyond that, Simply Wall St extrapolates cash flows out to 2035 using gradually changing growth assumptions, all expressed in today's money through discounting.
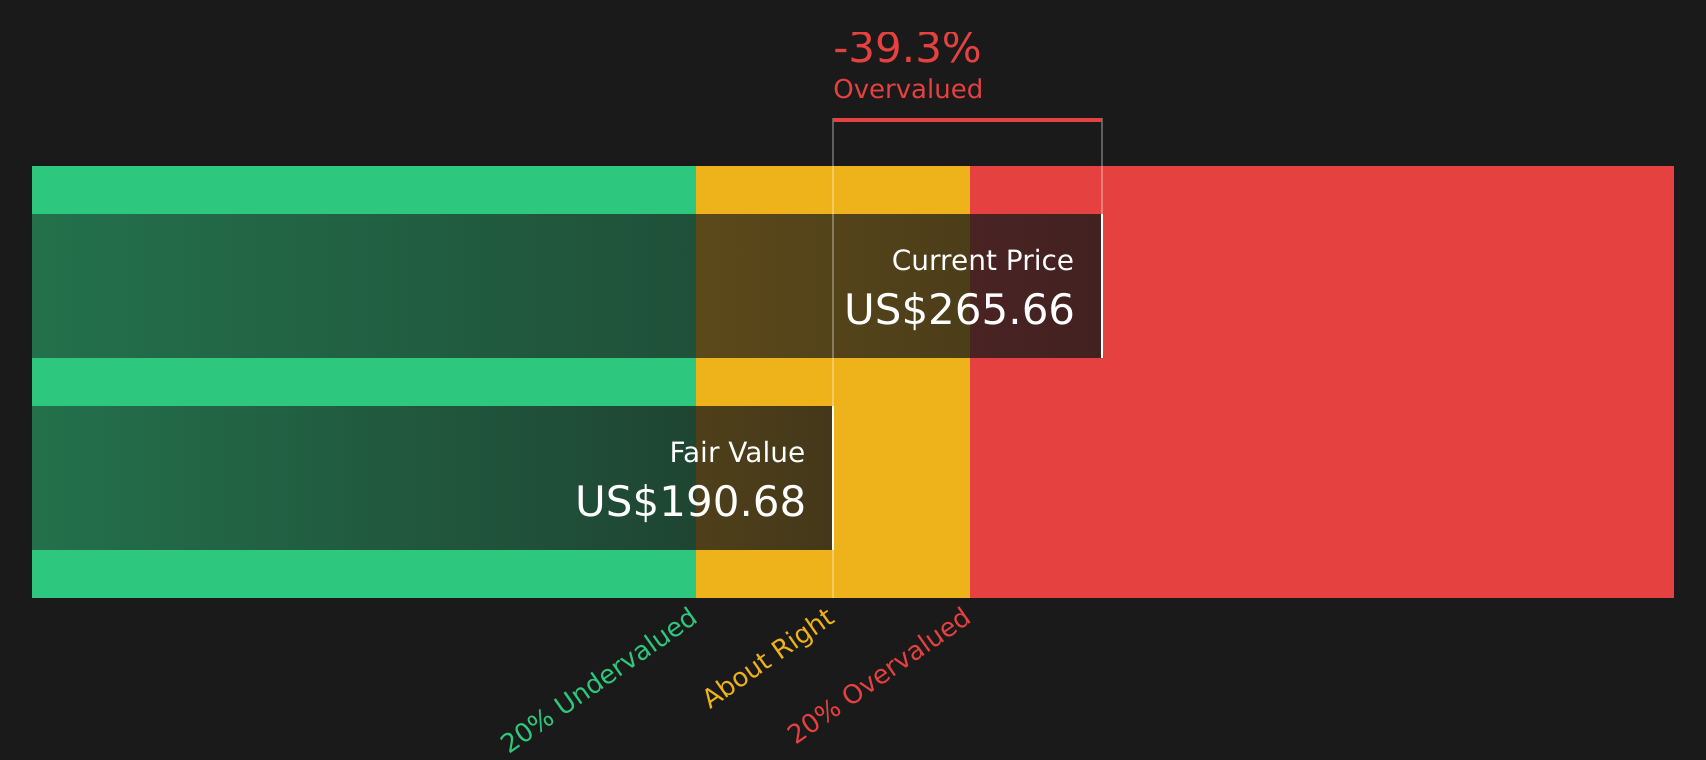
Putting these cash flows together, the model arrives at an estimated intrinsic value of about $188.58 per share, compared with the recent share price of around $280. Under this specific DCF setup, the stock is treated as approximately 48.6% overvalued.
DCF models are sensitive to their inputs, but on these numbers the current price sits well above the cash flow based estimate.
Result: OVERVALUED
Our Discounted Cash Flow (DCF) analysis suggests Cadence Design Systems may be overvalued by 48.6%. Discover 63 high quality undervalued stocks or create your own screener to find better value opportunities.
Approach 2: Cadence Design Systems Price vs Earnings
For profitable companies, the P/E ratio is a useful way to see how much you are paying for each dollar of current earnings. It links directly to what the business is generating today, which many investors find easier to interpret than long term cash flow models.
In general, higher expected growth and lower perceived risk can support a higher P/E, while slower expected growth or higher risk usually point to a lower, more conservative multiple. That is why context matters when you look at any single number.
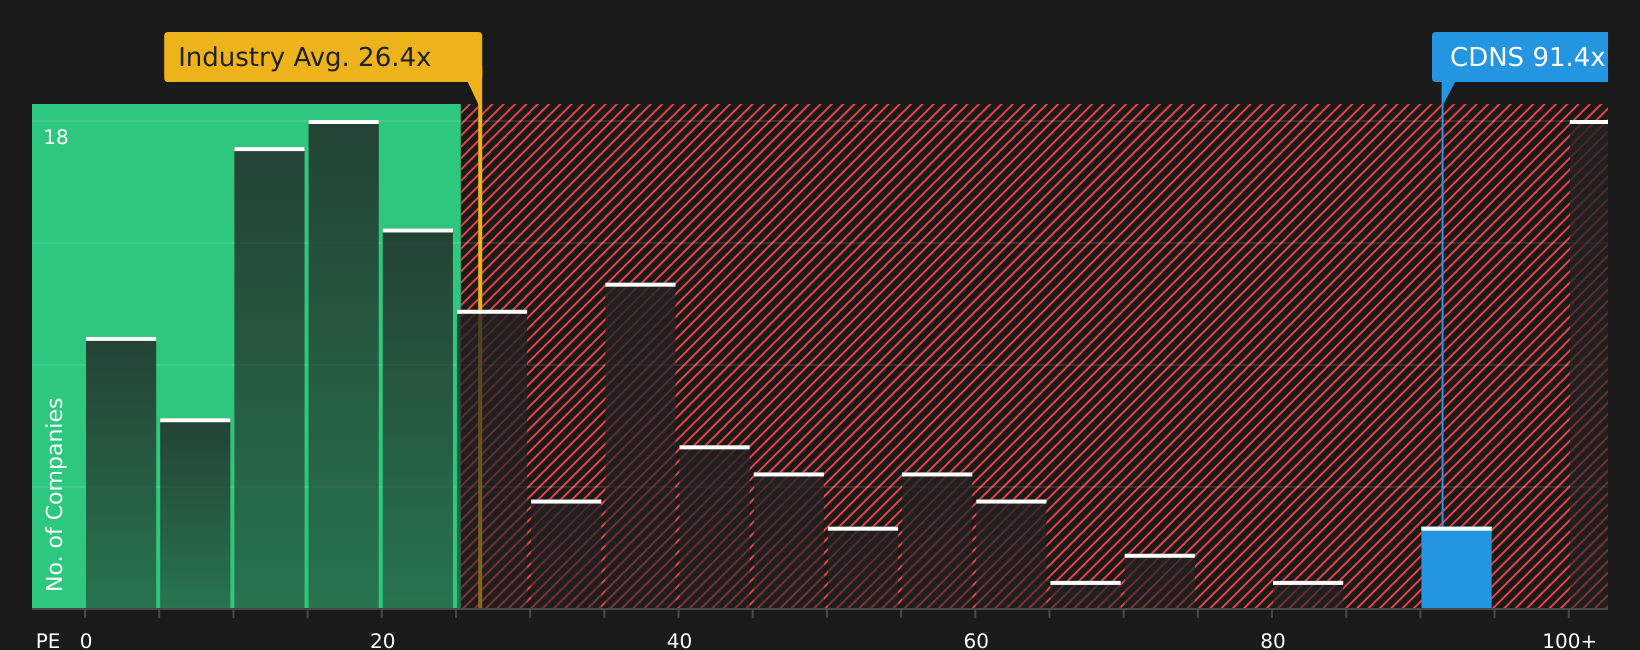
Cadence Design Systems currently trades on a P/E of about 69.76x. This is well above the Software industry average P/E of 29.17x and above the peer group average of 38.52x. Simply Wall St also calculates a proprietary “Fair Ratio” of 37.79x, which reflects what the P/E might be given Cadence Design Systems' earnings growth profile, industry, profit margins, market cap and company specific risks.
This Fair Ratio is more tailored than a simple industry or peer comparison because it blends these fundamentals into one benchmark. Comparing 69.76x to the 37.79x Fair Ratio suggests the current P/E is rich relative to that framework.
Result: OVERVALUED
P/E ratios tell one story, but what if the real opportunity lies elsewhere? Start investing in legacies, not executives. Discover our 20 top founder-led companies.
Upgrade Your Decision Making: Choose your Cadence Design Systems Narrative
Earlier the article highlighted that there is an even better way to think about valuation. Narratives are that tool, allowing you to write a clear story about Cadence Design Systems, link that story to a forecast for revenue, earnings and margins, and then see a Fair Value that you can compare with the current price on Simply Wall St's Community page. On that page, Narratives are updated automatically as new earnings or news arrive, and different investors can hold very different views. For example, one Narrative might see Fair Value near US$200 based on slower growth and lower margins, while another might see Fair Value above US$400 based on stronger AI related demand and higher profitability assumptions.
Do you think there's more to the story for Cadence Design Systems? Head over to our Community to see what others are saying!

This article by Simply Wall St is general in nature. We provide commentary based on historical data and analyst forecasts only using an unbiased methodology and our articles are not intended to be financial advice. It does not constitute a recommendation to buy or sell any stock, and does not take account of your objectives, or your financial situation. We aim to bring you long-term focused analysis driven by fundamental data. Note that our analysis may not factor in the latest price-sensitive company announcements or qualitative material. Simply Wall St has no position in any stocks mentioned.
Have feedback on this article? Concerned about the content? Get in touch with us directly. Alternatively, email editorial-team@simplywallst.com
Contact Us
Contact Number :+852 3852 8500Webull Securities Limited is licensed with the Securities and Futures Commission of Hong Kong (CE No. BNG700) for carrying out Type 1 License for Dealing in Securities, Type 2 License for Dealing in Futures Contracts and Type 4 License for Advising on Securities.

English