
Is It Too Late To Consider Burlington Stores (BURL) After Strong Share Price Gains?
- If you are wondering whether Burlington Stores at around US$328.73 is offering good value today, you are not alone. This article focuses squarely on that question.
- The stock has posted returns of 2.7% over 7 days, 9.4% over 30 days, 10.2% year to date, 39.5% over 1 year, 69.5% over 3 years and 5.0% over 5 years. This naturally raises questions about what is already priced in and what might still be on the table.
- Recent coverage of Burlington Stores has highlighted how investors are reassessing retail names and paying closer attention to the balance between growth potential and valuation. This broader focus on pricing power, store productivity and competitive position provides important context for interpreting the share price moves.
- Right now Burlington Stores holds a valuation score of 1 out of 6. The key question is how different valuation approaches, and a more comprehensive framework at the end of this article, might reshape how you see that number.
Burlington Stores scores just 1/6 on our valuation checks. See what other red flags we found in the full valuation breakdown.
Approach 1: Burlington Stores Discounted Cash Flow (DCF) Analysis
A Discounted Cash Flow, or DCF, model takes estimates of a company’s future cash flows and discounts them back to today’s dollars, aiming to arrive at an intrinsic value per share based on those projected cash flows.
For Burlington Stores, the model used is a 2 Stage Free Cash Flow to Equity approach. The company’s latest twelve month free cash flow is about $351.1 million. Analyst and extrapolated projections, provided in the model, show free cash flow estimates between $230.4 million in 2026 and $1,832.8 million in 2035, with Simply Wall St extending the forecast beyond the initial analyst horizon.
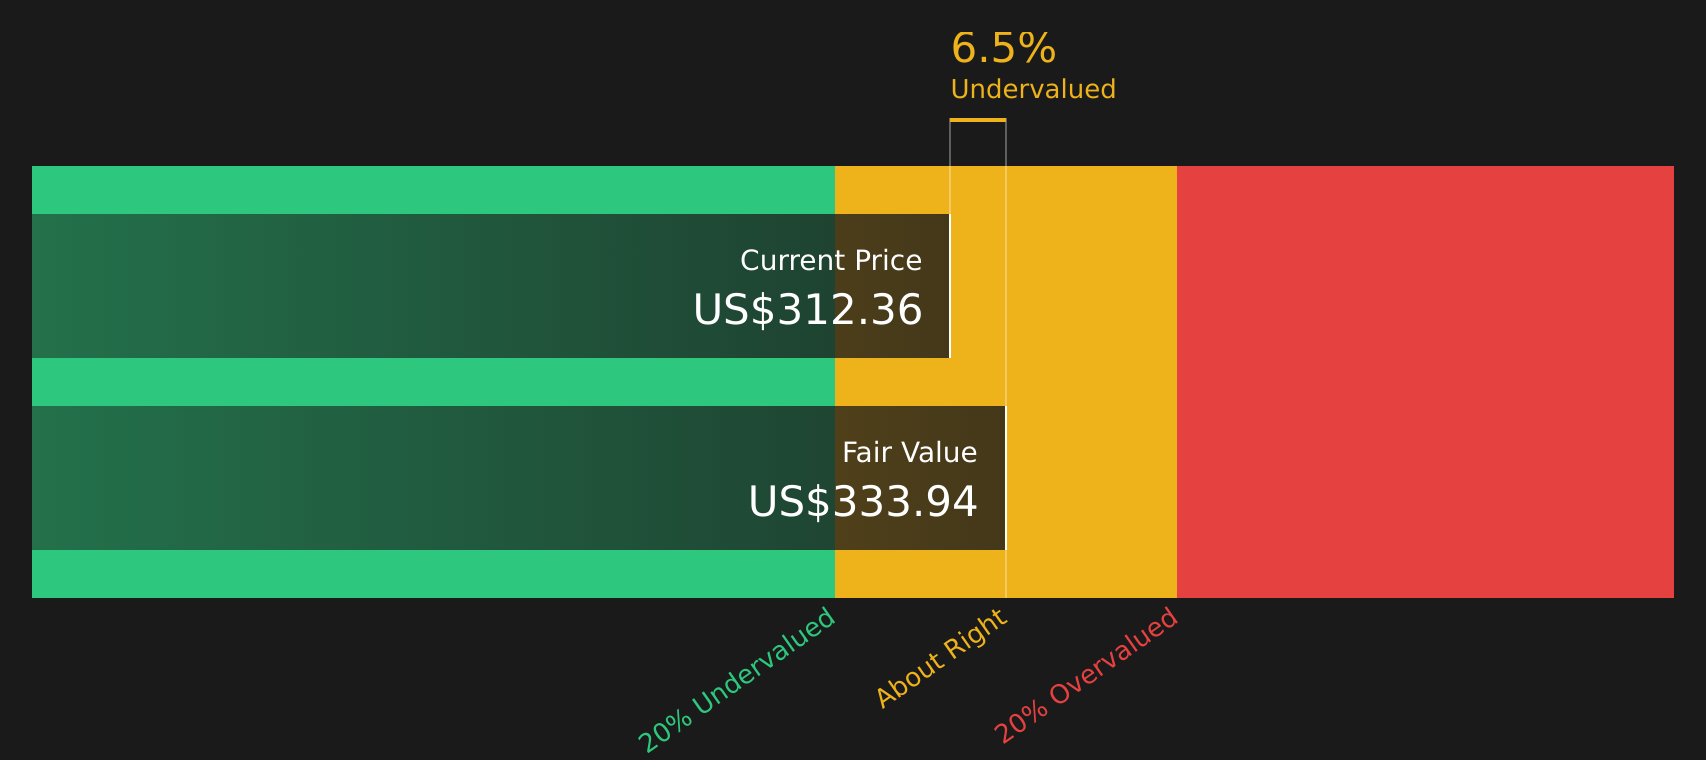
When all those future cash flows are discounted back to today, the model arrives at an estimated fair value of about $341.36 per share. Compared with a current share price of around $328.73, this implies a discount of approximately 3.7%. This indicates the stock is roughly in line with the DCF-based estimate rather than appearing significantly cheap or expensive.
Result: ABOUT RIGHT
Burlington Stores is fairly valued according to our Discounted Cash Flow (DCF), but this can change at a moment's notice. Track the value in your watchlist or portfolio and be alerted on when to act.
Approach 2: Burlington Stores Price vs Earnings
For profitable companies, the P/E ratio is a useful way to think about what you are paying for each dollar of current earnings. Investors typically accept a higher P/E when they expect stronger growth or see lower risk, and look for a lower P/E when growth expectations are more modest or risks feel higher.
Burlington Stores currently trades on a P/E of about 33.38x. That sits above the Specialty Retail industry average P/E of roughly 18.78x and also above the peer average of about 18.83x. On simple comparisons, the shares are priced at a higher earnings multiple than many similar names.
Simply Wall St’s Fair Ratio framework goes a step further by estimating what P/E might make sense for Burlington Stores once factors like its earnings growth profile, profit margins, industry, market cap and risk characteristics are considered together. This Fair Ratio is 23.03x, which is below the current 33.38x. On this basis, the shares look expensive relative to what the Fair Ratio model suggests would be a more typical pricing for Burlington Stores.
Result: OVERVALUED

P/E ratios tell one story, but what if the real opportunity lies elsewhere? Start investing in legacies, not executives. Discover our 20 top founder-led companies.
Upgrade Your Decision Making: Choose your Burlington Stores Narrative
Earlier the article mentioned that there is an even better way to understand valuation, so this is where Narratives come in, giving you a simple story that links your view on Burlington Stores to a financial forecast and then to a fair value that you can compare with the current share price.
A Narrative on Simply Wall St is your own clear explanation of what you think is happening at Burlington Stores, tied directly to numbers like future revenue, earnings and margins instead of sitting separate from the data.
On the Community page, used by millions of investors, you can pick or create a Burlington Stores Narrative that lines up with your expectations. You can then see an automatically generated fair value and whether that sits above or below the current price, to help you decide if the stock looks more attractive or less attractive for your goals.
These Narratives update as new information arrives, such as news, earnings, buybacks or guidance. As a result, the fair value and thesis adjust without you needing to rebuild a model each time.
For example, one Burlington Stores Narrative might lean closer to the higher US$430 analyst target, emphasizing store expansion and margin improvement. Another might sit nearer the US$300 target, stressing risks from store growth, tariffs, digital investment and consumer pressure, and you can see both stories quantified side by side.
Do you think there's more to the story for Burlington Stores? Head over to our Community to see what others are saying!

This article by Simply Wall St is general in nature. We provide commentary based on historical data and analyst forecasts only using an unbiased methodology and our articles are not intended to be financial advice. It does not constitute a recommendation to buy or sell any stock, and does not take account of your objectives, or your financial situation. We aim to bring you long-term focused analysis driven by fundamental data. Note that our analysis may not factor in the latest price-sensitive company announcements or qualitative material. Simply Wall St has no position in any stocks mentioned.
Have feedback on this article? Concerned about the content? Get in touch with us directly. Alternatively, email editorial-team@simplywallst.com
Contact Us
Contact Number :+852 3852 8500Webull Securities Limited is licensed with the Securities and Futures Commission of Hong Kong (CE No. BNG700) for carrying out Type 1 License for Dealing in Securities, Type 2 License for Dealing in Futures Contracts and Type 4 License for Advising on Securities.

English