
A Look At Helix Energy Solutions (HLX) Valuation After Strong Q4 Beat And New UK North Sea Contract
Why Helix Energy Solutions Group (HLX) Is Back on Investor Radars
Helix Energy Solutions Group (HLX) is drawing fresh attention after Q4 results exceeded analyst expectations, delivered the strongest fourth quarter EBITDA since 2013, and included a new multi year well plug and abandonment contract in the UK North Sea.
See our latest analysis for Helix Energy Solutions Group.
The recent Q4 beat and new North Sea contract have arrived alongside a 50.2% 90 day share price return and a 42.6% 1 year total shareholder return, suggesting building momentum after a softer 7 day share price pullback.
If Q4’s strength has you looking across the energy services space, it could be a good moment to scan for other offshore and infrastructure names using the 28 power grid technology and infrastructure stocks.
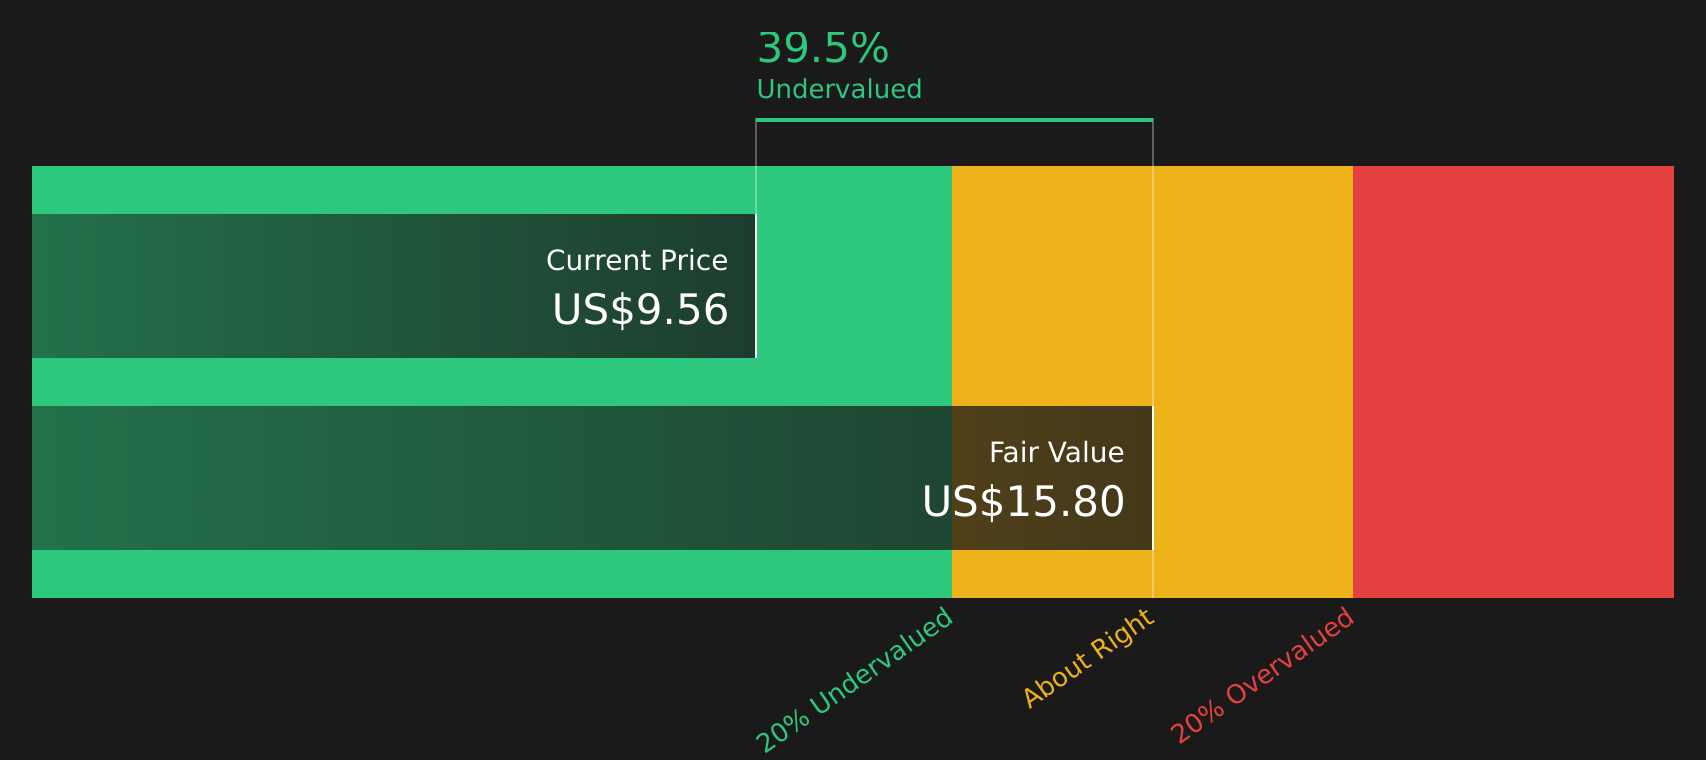
With Helix trading at US$9.61 against an analyst price target of US$11.75 and an estimated intrinsic discount of about 39%, the key question is whether recent gains leave more upside on the table or if the market is already pricing in future growth.
Most Popular Narrative: 1.4% Undervalued
The most followed narrative pegs Helix Energy Solutions Group’s fair value at $9.75, just above the last close at $9.61, which puts a lot of weight on how its contracts, margins, and cash flows evolve from here under an 8.07% discount rate.
The analysts have a consensus price target of $10.125 for Helix Energy Solutions Group based on their expectations of its future earnings growth, profit margins and other risk factors. However, there is a degree of disagreement amongst analysts, with the most bullish reporting a price target of $11.0, and the most bearish reporting a price target of just $9.0.
Curious what kind of revenue path, margin uplift, and earnings multiple need to line up to support that valuation gap and buyback story over the next few years? The full narrative lays out a tight set of growth and profitability assumptions, plus the earnings and share count profile that need to land almost perfectly for this fair value to hold.
Result: Fair Value of $9.75 (UNDERVALUED)
Have a read of the narrative in full and understand what's behind the forecasts.
However, you still need to weigh risks, such as project deferrals that hit vessel utilization and higher labor and maintenance costs that pressure margins, just as expectations reset.
Find out about the key risks to this Helix Energy Solutions Group narrative.
Another View: Earnings Multiple Sends A Different Signal
While the SWS model points to Helix trading about 39.4% below its $15.87 future cash flow value, the current P/E of 46x is well above both the US Energy Services industry at 26x and the peer average at 35.1x, and even above a 17.6x fair ratio. This raises the question of whether the market is paying up for quality, or simply paying too much.
Look into how the SWS DCF model arrives at its fair value.
Next Steps
With sentiment clearly mixed, and both risks and rewards in play, now is a good time to check the data yourself and weigh the 2 key rewards and 2 important warning signs.
Looking for more investment ideas?
If Helix has your attention, do not stop here. Expand your watchlist with fresh ideas that match your style before the next move passes you by.
- Spot potential value early by scanning screener containing 25 high quality undiscovered gems that pair strong fundamentals with limited market attention.
- Strengthen portfolio resilience by reviewing 68 resilient stocks with low risk scores built around companies with lower risk scores.
- Target quality at a discount by checking 59 high quality undervalued stocks that combine solid cash flows with supportive balance sheets.
This article by Simply Wall St is general in nature. We provide commentary based on historical data and analyst forecasts only using an unbiased methodology and our articles are not intended to be financial advice. It does not constitute a recommendation to buy or sell any stock, and does not take account of your objectives, or your financial situation. We aim to bring you long-term focused analysis driven by fundamental data. Note that our analysis may not factor in the latest price-sensitive company announcements or qualitative material. Simply Wall St has no position in any stocks mentioned.
Have feedback on this article? Concerned about the content? Get in touch with us directly. Alternatively, email editorial-team@simplywallst.com
Contact Us
Contact Number :+852 3852 8500Webull Securities Limited is licensed with the Securities and Futures Commission of Hong Kong (CE No. BNG700) for carrying out Type 1 License for Dealing in Securities, Type 2 License for Dealing in Futures Contracts and Type 4 License for Advising on Securities.

English