
A Look At Star Shine Holdings Group’s Valuation After Widening Losses And Lower Sales In Full Year 2025
Earnings event puts Star Shine Holdings Group in focus
Star Shine Holdings Group (SEHK:1440) is drawing attention after reporting full year 2025 results, with sales of CNY 513.79 million and a net loss of CNY 98.29 million from continuing operations.
Compared with the prior year, sales were CNY 584.54 million, while net loss stood at CNY 12.75 million. Basic and diluted loss per share from continuing operations were CNY 0.078, higher than CNY 0.0101 a year earlier.
See our latest analysis for Star Shine Holdings Group.
The earnings release comes after a sharp run in the shares, with a 90 day share price return of 86.34% lifting the stock to HK$13.23 and contributing to a very large 5 year total shareholder return of 2,444.23%. However, the 7 day share price return of negative 12.67% hints that near term momentum has cooled.
If this kind of sharp move has you thinking about what else is out there, it could be a good moment to scan 96 top founder-led companies
With the share price up strongly over the past year despite a larger loss and weaker sales, the key question now is whether Star Shine is trading below its underlying value or if the market is already factoring in expectations of future growth.
Preferred Price-to-Sales Multiple of 28.5x: Is it justified?
On Simply Wall St estimates, Star Shine Holdings Group trades on a P/S of 28.5x at a last close of HK$13.23, which stands far above both peers and the wider Hong Kong Luxury industry.
The P/S ratio compares the company’s market value to its sales, so a higher multiple usually reflects strong expectations about future revenue quality, durability, or growth. For a business that is currently loss making, the P/S figure can sometimes become a shorthand for how optimistic the market is willing to be about a turnaround story.
Here, the disconnect is clear. 1440 is currently unprofitable, losses have been increasing at an annual rate of 78.3% over the past five years, and earnings have declined by 78.3% per year over that period. Yet the market is assigning a P/S of 28.5x compared with a peer average of 0.4x and a Hong Kong Luxury industry average of 0.7x. That is an aggressive premium and suggests investors are pricing in a very optimistic path that is not directly visible in the historical earnings record provided.
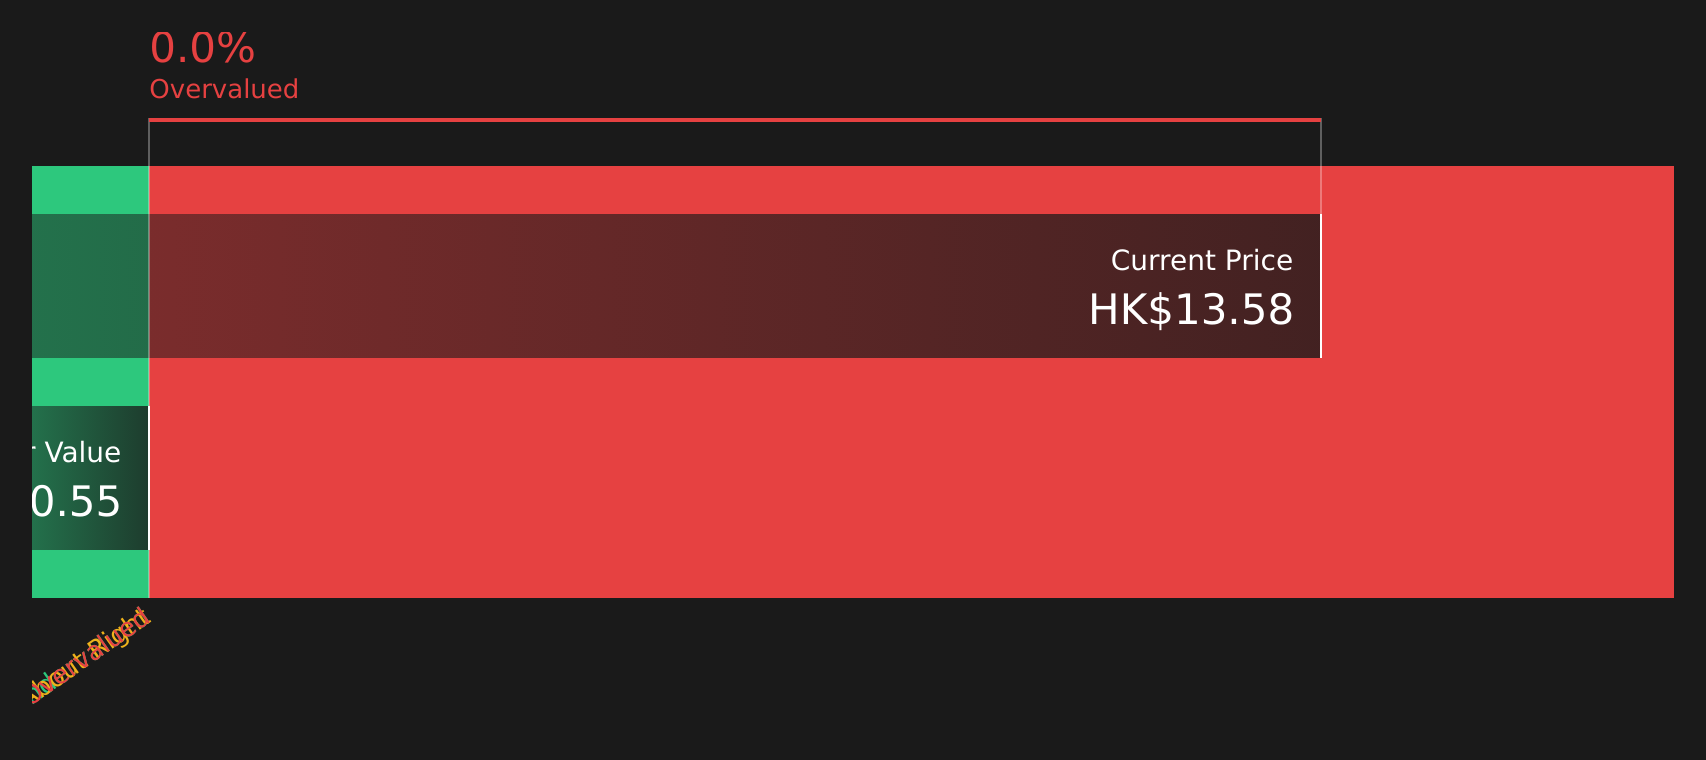
Against that backdrop, the SWS DCF model adds another reference point. It indicates that 1440 at HK$13.23 is trading above an estimated future cash flow value of HK$0.68. While any DCF output is only as good as the assumptions behind it, setting a current share price that far above an internal fair value estimate reinforces how stretched the earnings-based expectations already look on both a cash flow and sales multiple basis.
See what the numbers say about this price — find out in our valuation breakdown.
Result: Price-to-Sales of 28.5x (OVERVALUED)
However, the larger CNY 98.29 million loss and P/S of 28.5x, far above industry levels, mean any setback in sales or cash flow assumptions could affect sentiment.
Find out about the key risks to this Star Shine Holdings Group narrative.
Another angle on Star Shine’s valuation
The SWS DCF model points in the same direction as the rich 28.5x P/S. At HK$13.23, Star Shine is priced above an estimated future cash flow value of HK$0.68, which implies limited margin for error if sentiment or expectations change. How comfortable are you with that gap?
Look into how the SWS DCF model arrives at its fair value.
Simply Wall St performs a discounted cash flow (DCF) on every stock in the world every day (check out Star Shine Holdings Group for example). We show the entire calculation in full. You can track the result in your watchlist or portfolio and be alerted when this changes, or use our stock screener to discover 244 high quality undervalued stocks. If you save a screener we even alert you when new companies match - so you never miss a potential opportunity.
Next Steps
If this analysis feels finely balanced, take a moment to review the figures yourself and decide where you stand, then check the 1 important warning sign.
Looking for more investment ideas?
If Star Shine has you thinking about what comes next, do not stop here. Broaden your watchlist now and keep fresh opportunities on your radar.
- Target dependable income prospects by checking companies in the 485 dividend fortresses.
- Hunt for quality businesses at attractive prices using the 244 high quality undervalued stocks.
- Prioritise stability and capital protection by reviewing the 284 resilient stocks with low risk scores.
This article by Simply Wall St is general in nature. We provide commentary based on historical data and analyst forecasts only using an unbiased methodology and our articles are not intended to be financial advice. It does not constitute a recommendation to buy or sell any stock, and does not take account of your objectives, or your financial situation. We aim to bring you long-term focused analysis driven by fundamental data. Note that our analysis may not factor in the latest price-sensitive company announcements or qualitative material. Simply Wall St has no position in any stocks mentioned.
Have feedback on this article? Concerned about the content? Get in touch with us directly. Alternatively, email editorial-team@simplywallst.com
Contact Us
Contact Number :+852 3852 8500Webull Securities Limited is licensed with the Securities and Futures Commission of Hong Kong (CE No. BNG700) for carrying out Type 1 License for Dealing in Securities, Type 2 License for Dealing in Futures Contracts and Type 4 License for Advising on Securities.

English