
Is Avista (AVA) Priced Fairly After Recent Steady Share Performance And Dividend Outlook?
- If you are wondering whether Avista at around US$41.21 is a fair price, a bargain, or something to be cautious about, this article is designed to help you frame that question clearly before you act.
- Over the recent period, Avista's share price closed at US$41.21, with returns of 2.1% over 7 days, 3.2% over 30 days, 6.4% year to date, 4.2% over 1 year, 9.8% over 3 years, and 13.1% over 5 years.
- Recent coverage of Avista has focused on its role in the Integrated Utilities space and how changing expectations around regulated returns, capital spending, and interest rates might affect investor sentiment. This context helps explain why even relatively modest price moves can attract attention from income focused and long term holders.
- On Simply Wall St's 6 point valuation checklist, Avista scores 3 out of 6. This invites a closer look at how different valuation methods line up and suggests that there may be an even more useful way to think about value by the end of this article.
Find out why Avista's 4.2% return over the last year is lagging behind its peers.
Approach 1: Avista Dividend Discount Model (DDM) Analysis
The Dividend Discount Model estimates what Avista shares might be worth today by projecting future dividends and discounting them back to a present value. It is particularly relevant here because income is a key reason many investors look at integrated utilities.
For Avista, the model uses a current dividend per share of US$2.101, a return on equity of 7.10% and an estimated payout ratio of 83.07%. That payout leaves limited earnings retained for growth, so the implied dividend growth rate is a modest 1.20%, calculated as set out in the DDM source provided.
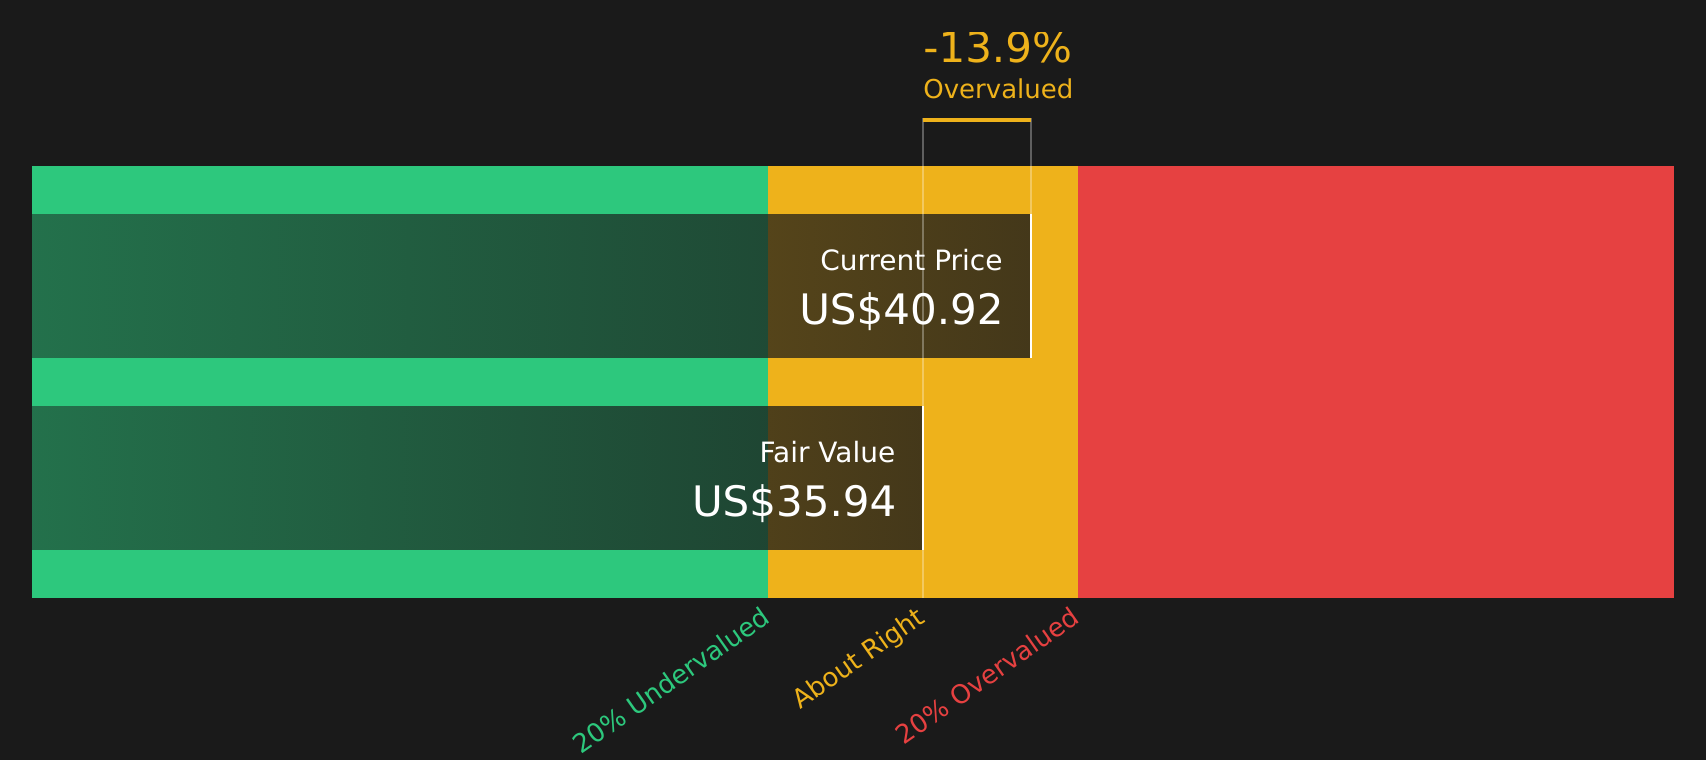
Feeding these inputs into the DDM gives an estimated intrinsic value of about US$36.38 per share. Relative to the recent share price of US$41.21, this implies the stock is around 13.3% above the modelled value. This indicates the market is placing a premium on Avista compared with this dividend-based estimate.
Result: OVERVALUED
Our Dividend Discount Model (DDM) analysis suggests Avista may be overvalued by 13.3%. Discover 53 high quality undervalued stocks or create your own screener to find better value opportunities.
Approach 2: Avista Price vs Earnings
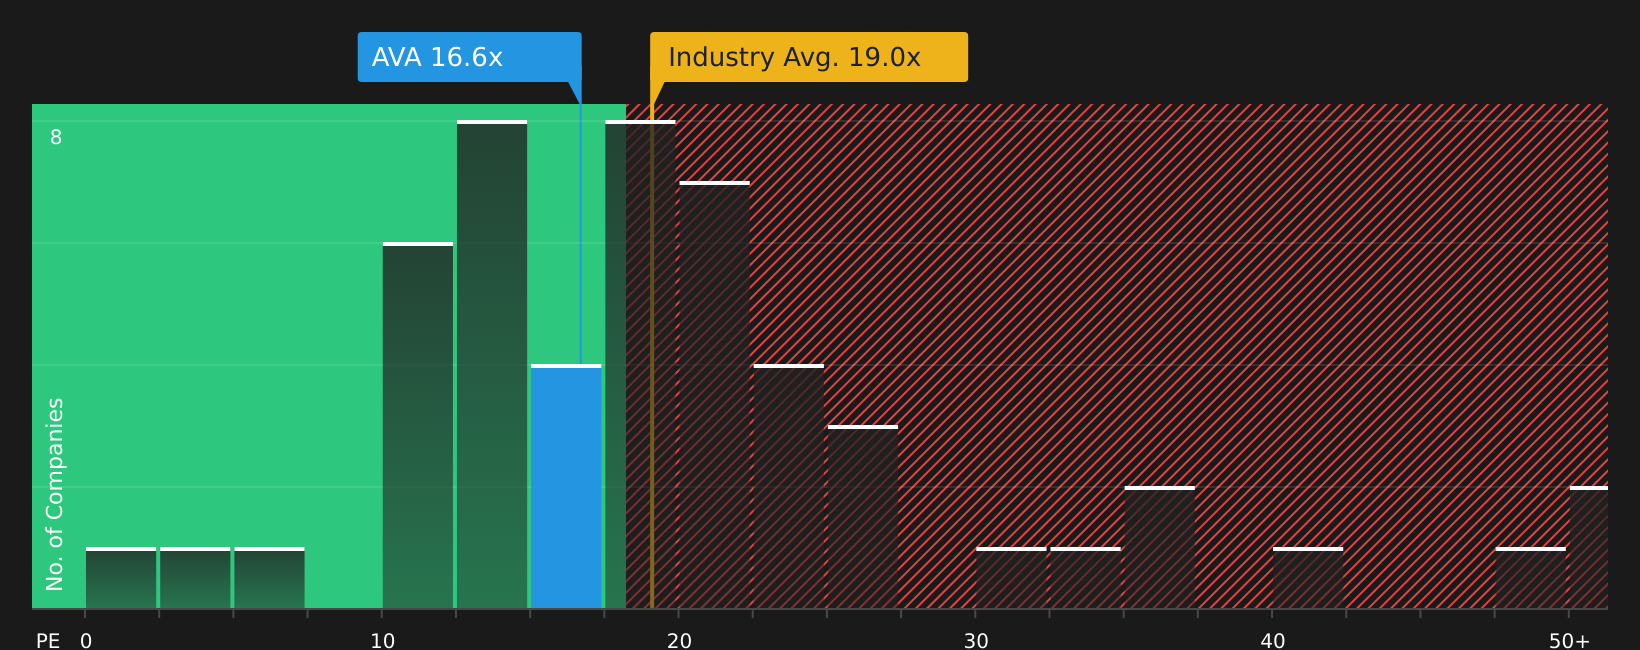
For a profitable company like Avista, the P/E ratio is a straightforward way to connect what you pay for each share with the earnings that support it. It helps you see how much investors are currently willing to pay for each dollar of profit.
What counts as a “normal” or “fair” P/E often reflects how the market views growth potential and risk. Higher expected growth or lower perceived risk can justify a higher P/E, while slower expected growth or higher risk tends to line up with a lower P/E.
Avista currently trades on a P/E of 17.62x. That sits below the Integrated Utilities industry average P/E of 19.08x and below the peer average of 25.63x. Simply Wall St’s Fair Ratio for Avista is 18.49x. This Fair Ratio is a proprietary estimate of what Avista’s P/E might be given its earnings profile, industry, profit margins, market cap and risk characteristics. It can be more useful than a simple peer or industry comparison because it adjusts for company specific factors rather than assuming all utilities deserve the same multiple.
With Avista’s actual P/E of 17.62x below the Fair Ratio of 18.49x, the shares screen as modestly undervalued on this metric.
Result: UNDERVALUED
P/E ratios tell one story, but what if the real opportunity lies elsewhere? Start investing in legacies, not executives. Discover our 18 top founder-led companies.
Upgrade Your Decision Making: Choose your Avista Narrative
Earlier it was mentioned that there is an even better way to understand valuation. Narratives on Simply Wall St's Community page give you a clear story behind the numbers by linking your view of Avista's business to a forecast for revenue, earnings and margins, and then to a Fair Value that you can compare with the current share price to help decide whether to act now or wait. Each Narrative updates automatically when fresh news or earnings arrive, and different investors sometimes land on very different views. For example, some may see a Fair Value near the higher analyst target of US$50.00 if they focus on electrification and long term capital plans, while others may see a value closer to the lower target of US$39.00 if they prioritize regulatory and environmental risks and want a larger margin of safety.
Do you think there's more to the story for Avista? Head over to our Community to see what others are saying!

This article by Simply Wall St is general in nature. We provide commentary based on historical data and analyst forecasts only using an unbiased methodology and our articles are not intended to be financial advice. It does not constitute a recommendation to buy or sell any stock, and does not take account of your objectives, or your financial situation. We aim to bring you long-term focused analysis driven by fundamental data. Note that our analysis may not factor in the latest price-sensitive company announcements or qualitative material. Simply Wall St has no position in any stocks mentioned.
Have feedback on this article? Concerned about the content? Get in touch with us directly. Alternatively, email editorial-team@simplywallst.com
Contact Us
Contact Number :+852 3852 8500Webull Securities Limited is licensed with the Securities and Futures Commission of Hong Kong (CE No. BNG700) for carrying out Type 1 License for Dealing in Securities, Type 2 License for Dealing in Futures Contracts and Type 4 License for Advising on Securities.

English