
Is It Too Late To Reassess East Buy Holding (SEHK:1797) After Its 113% One-Year Rally?
- If you are wondering whether East Buy Holding's current share price lines up with its underlying worth, you are not alone.
- The stock has pulled back 6.0% over the last week and 14.4% over the last month, yet it is still up 42.7% year to date and 113.4% over the past year. This can change how you think about both potential upside and risk.
- Recent attention on East Buy Holding has focused on its position within the Consumer Retailing space and how it is responding to sector wide shifts. This helps set expectations around its current market profile. At the same time, investors are watching how sentiment around the business develops, as this context often influences how much of the recent performance is already reflected in the share price.
- Simply Wall St currently gives East Buy Holding a valuation score of 1 out of 6. The next step is to look at how different valuation approaches judge the stock today and then consider an even richer way to think about valuation at the end of this article.
East Buy Holding scores just 1/6 on our valuation checks. See what other red flags we found in the full valuation breakdown.
Approach 1: East Buy Holding Discounted Cash Flow (DCF) Analysis
A Discounted Cash Flow, or DCF, model estimates what a business could be worth by projecting its future cash flows and then discounting those back to today’s value.
For East Buy Holding, the model used is a 2 Stage Free Cash Flow to Equity approach based on cash flows reported in CN¥. The latest twelve month free cash flow is CN¥516.8 million. Analyst input is available up to 2028, with free cash flow for that year projected at CN¥981 million. Beyond that, Simply Wall St extends the projections out to 2035. Each year’s free cash flow estimate is discounted back to today using the DCF framework.
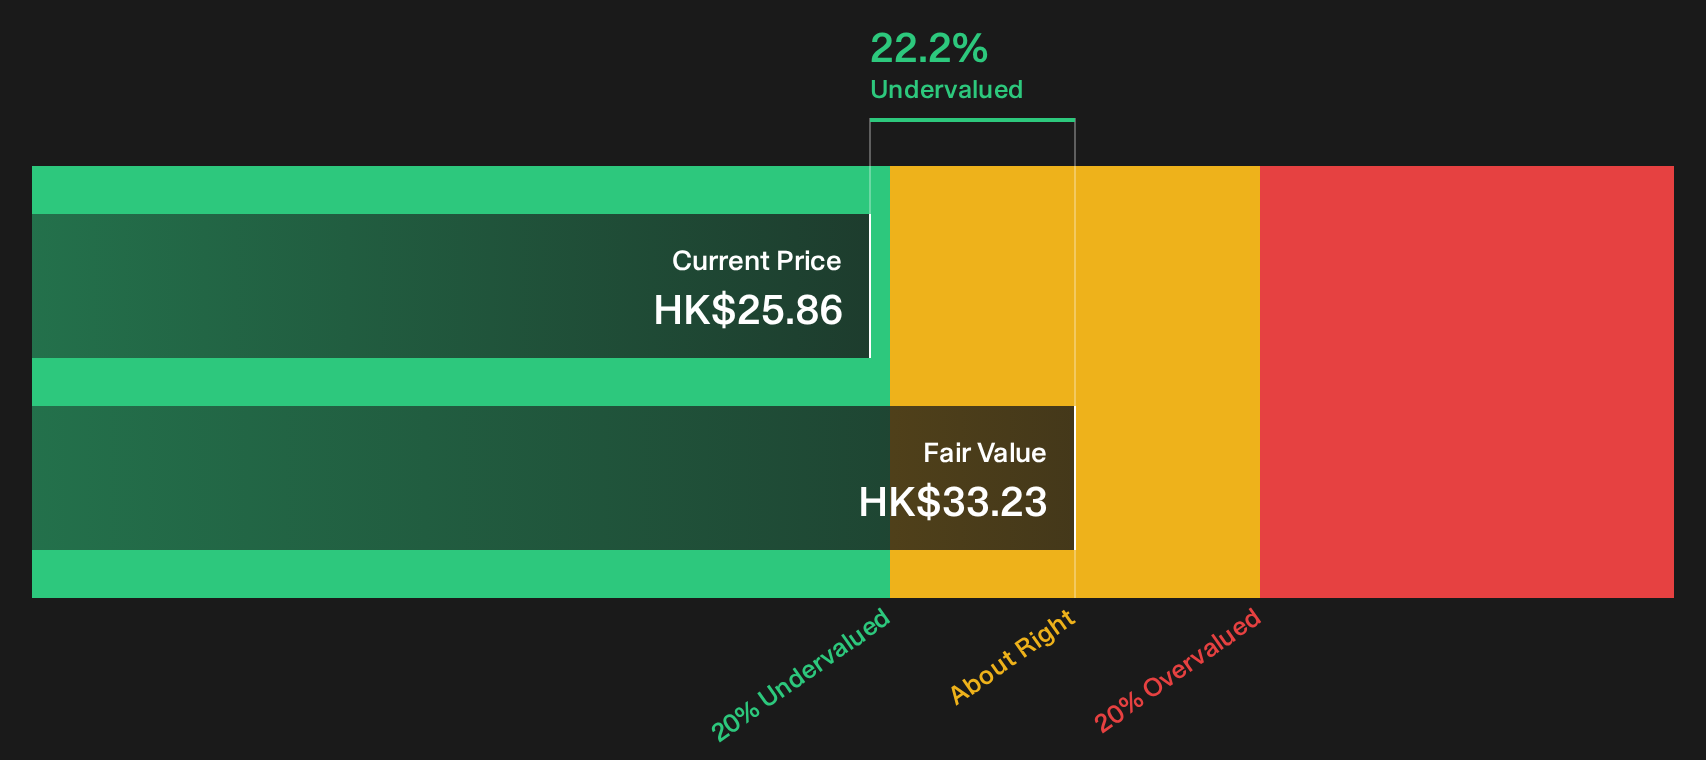
Combining these cash flow projections results in an estimated intrinsic value of HK$30.39 per share. Compared with the current market price, this implies the stock is around 15.0% undervalued according to this model.
Result: UNDERVALUED
Our Discounted Cash Flow (DCF) analysis suggests East Buy Holding is undervalued by 15.0%. Track this in your watchlist or portfolio, or discover 245 more high quality undervalued stocks.
Approach 2: East Buy Holding Price vs Earnings
For profitable companies, the P/E ratio is a useful way to see how much you are paying for each unit of earnings, which makes it a common shorthand for how the market is currently viewing a business.
What counts as a “normal” P/E often reflects two things: how much growth investors expect in those earnings, and how much risk they see in the business. Higher expected growth or lower perceived risk can justify a higher P/E, while slower growth or higher risk typically point to a lower multiple.
East Buy Holding currently trades on a P/E of 69.82x. That is well above the Consumer Retailing industry average of 17.34x and also above the peer average of 21.64x. To go a step further, Simply Wall St calculates a proprietary “Fair Ratio” for the stock of 25.10x. This Fair Ratio is designed to reflect what P/E might be reasonable given factors such as earnings growth, profit margins, industry, market cap and key risks, rather than relying only on simple peer or industry comparisons.
Comparing the current P/E of 69.82x with the Fair Ratio of 25.10x suggests East Buy Holding is trading above the level implied by these fundamentals.
Result: OVERVALUED

P/E ratios tell one story, but what if the real opportunity lies elsewhere? Start investing in legacies, not executives. Discover our 96 top founder-led companies.
Upgrade Your Decision Making: Choose your East Buy Holding Narrative
Earlier it was mentioned that there is an even better way to understand valuation, so meet Narratives, a simple way to connect your view of East Buy Holding’s future with a financial forecast and a fair value that you can compare directly with today’s share price.
A Narrative is your story for the company, where you set assumptions for fair value, future revenue, earnings and margins, then see how that story translates into a clear estimate of what the shares might be worth.
On Simply Wall St’s Community page, used by millions of investors, Narratives are easy to set up, and they also update automatically when new information such as news or earnings is added. This means your fair value view stays current without extra work.
This helps you decide whether you see East Buy Holding as priced attractively or richly at any point in time, because you can compare your Narrative based fair value to the live market price and adjust your stance if the gap between the two becomes too wide or too small.
For example, one East Buy Holding Narrative on the Community page may assume very strong revenue growth and a higher fair value, while another assumes slower growth and a much lower fair value, showing how the same data can support very different decisions.
Do you think there's more to the story for East Buy Holding? Head over to our Community to see what others are saying!

This article by Simply Wall St is general in nature. We provide commentary based on historical data and analyst forecasts only using an unbiased methodology and our articles are not intended to be financial advice. It does not constitute a recommendation to buy or sell any stock, and does not take account of your objectives, or your financial situation. We aim to bring you long-term focused analysis driven by fundamental data. Note that our analysis may not factor in the latest price-sensitive company announcements or qualitative material. Simply Wall St has no position in any stocks mentioned.
Have feedback on this article? Concerned about the content? Get in touch with us directly. Alternatively, email editorial-team@simplywallst.com
Contact Us
Contact Number :+852 3852 8500Webull Securities Limited is licensed with the Securities and Futures Commission of Hong Kong (CE No. BNG700) for carrying out Type 1 License for Dealing in Securities, Type 2 License for Dealing in Futures Contracts and Type 4 License for Advising on Securities.

English