
Natera’s (NASDAQ:NTRA) Q1 CY2026 Sales Top Estimates

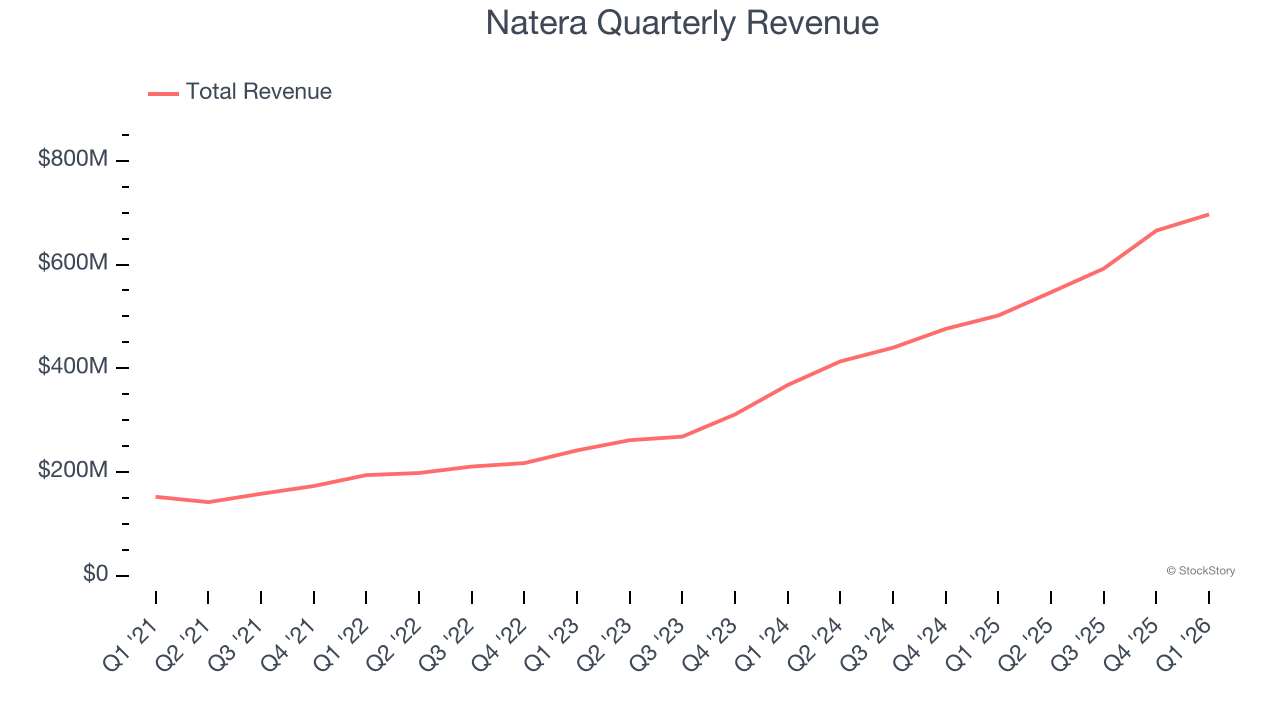
Genetic testing company Natera (NASDAQ:NTRA). announced better-than-expected revenue in Q1 CY2026, with sales up 38.8% year on year to $696.6 million. Its GAAP loss of $0.60 per share was 8.4% below analysts’ consensus estimates.
Is now the time to buy Natera? Find out by accessing our full research report, it’s free.
Natera (NTRA) Q1 CY2026 Highlights:
- Revenue: $696.6 million vs analyst estimates of $613.9 million (38.8% year-on-year growth, 13.5% beat)
- EPS (GAAP): -$0.60 vs analyst expectations of -$0.55 (8.4% miss)
- Adjusted Operating Income: -$93.52 million vs analyst estimates of -$83.6 million (-13.4% margin, 11.9% miss)
- Operating Margin: -13.4%, up from -15.8% in the same quarter last year
- Sales Volumes rose 18.5% year on year (16.2% in the same quarter last year)
- Market Capitalization: $30.71 billion
“We had an outstanding first quarter, reaching over one million units processed in a single quarter for the first time and delivering strong growth across all areas,” said Steve Chapman, chief executive officer of Natera.
Company Overview
Founded in 2003 as Gene Security Network before rebranding in 2012, Natera (NASDAQ:NTRA) develops and commercializes genetic tests for prenatal screening, cancer detection, and organ transplant monitoring using its proprietary cell-free DNA technology.
Revenue Growth
A company’s long-term sales performance is one signal of its overall quality. Any business can put up a good quarter or two, but many enduring ones grow for years. Luckily, Natera’s sales grew at an incredible 41% compounded annual growth rate over the last five years. Its growth surpassed the average healthcare company and shows its offerings resonate with customers, a great starting point for our analysis.
Long-term growth is the most important, but within healthcare, a half-decade historical view may miss new innovations or demand cycles. Natera’s annualized revenue growth of 43.9% over the last two years is above its five-year trend, suggesting its demand was strong and recently accelerated. 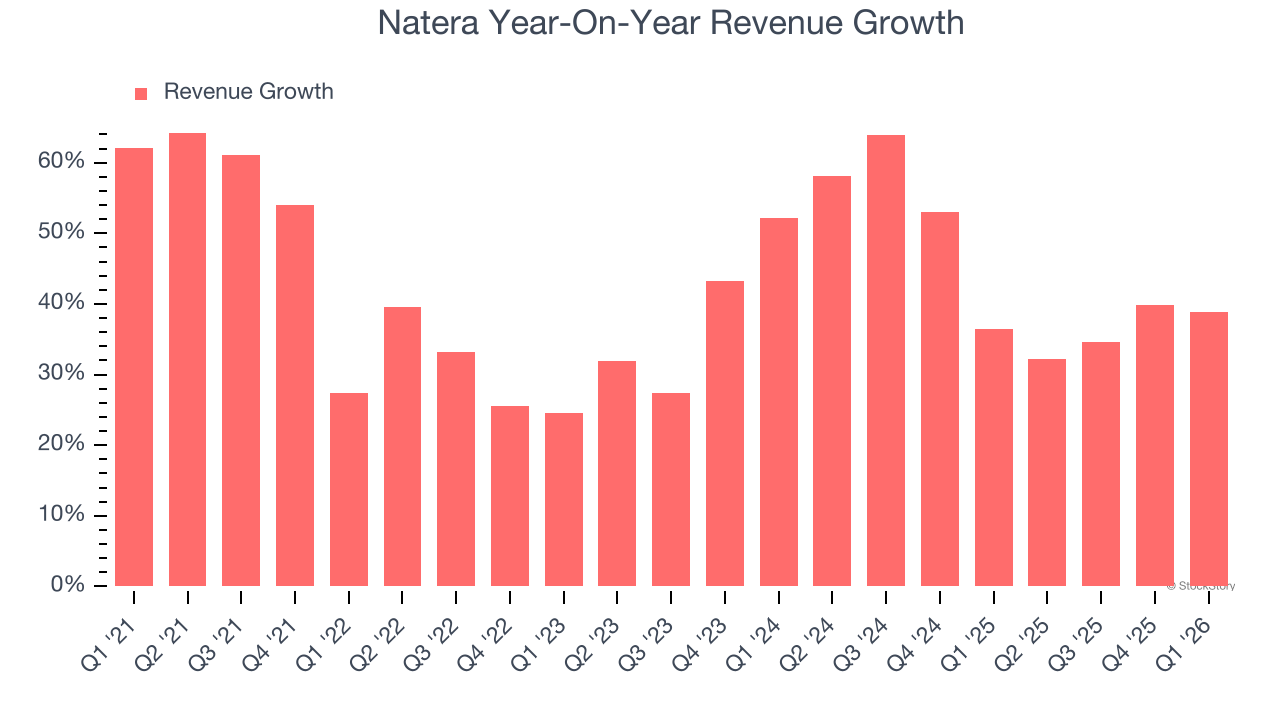
We can better understand the company’s revenue dynamics by analyzing its number of tests processed, which reached 1.01 million in the latest quarter. Over the last two years, Natera’s tests processed averaged 19.4% year-on-year growth. Because this number is lower than its revenue growth, we can see the company benefited from price increases. 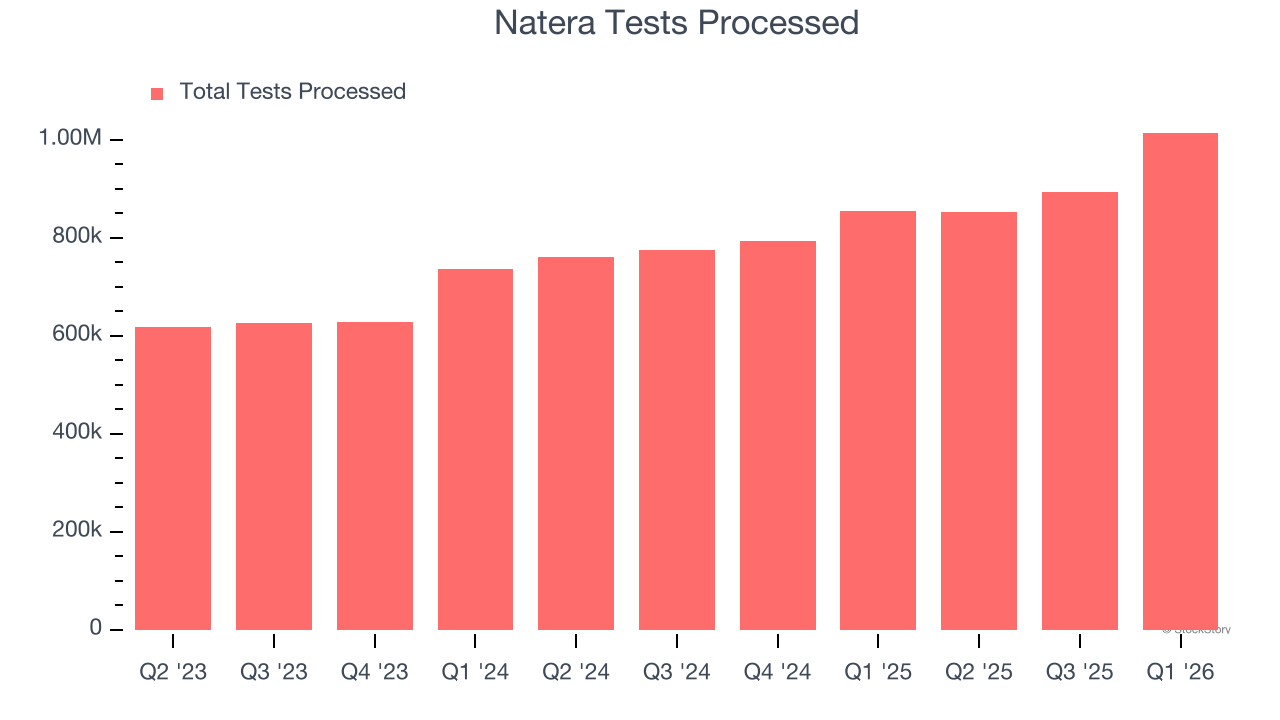
This quarter, Natera reported wonderful year-on-year revenue growth of 38.8%, and its $696.6 million of revenue exceeded Wall Street’s estimates by 13.5%.
Looking ahead, sell-side analysts expect revenue to grow 11.8% over the next 12 months, a deceleration versus the last two years. Still, this projection is healthy and indicates the market is forecasting success for its products and services.
ONE MORE THING: The $21 AI Application Stock Wall Street Forgot. While Wall Street obsesses over who’s building AI, one company is already using it to print money. And nobody’s paying attention.
AI chip stocks trade at ridiculous valuations. This company processes a trillion consumer signals monthly using AI and trades at a third of the price. The gap won’t last. The institutions will figure it out. You need to see this first. Read the FREE Report Before They Notice.
Adjusted Operating Margin
Natera’s high expenses have contributed to an average adjusted operating margin of negative 13.5% over the last five years. Unprofitable healthcare companies require extra attention because they could get caught swimming naked when the tide goes out.
On the plus side, Natera’s adjusted operating margin rose by 60.1 percentage points over the last five years, as its sales growth gave it operating leverage. Zooming in on its more recent performance, we can see the company’s trajectory is intact as its margin has also increased by 11.9 percentage points on a two-year basis. These data points are very encouraging and show momentum is on its side.
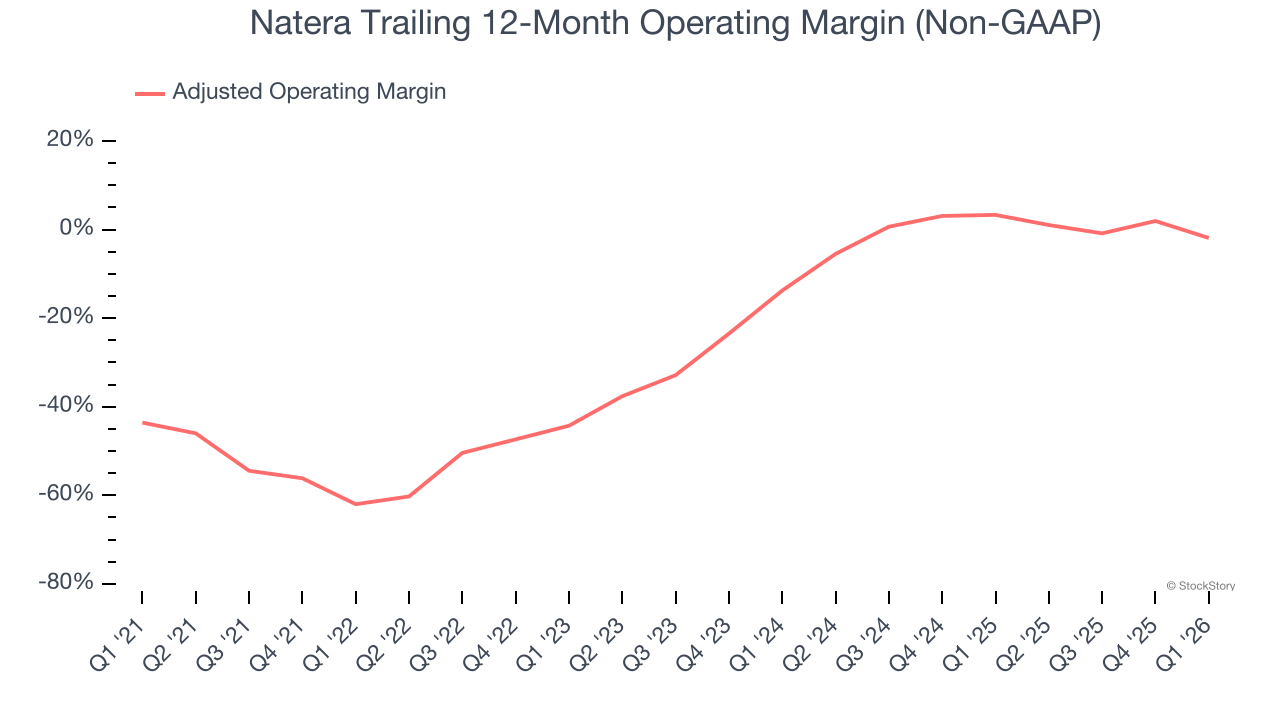
Natera’s adjusted operating margin was negative 13.4% this quarter.
Earnings Per Share
Revenue trends explain a company’s historical growth, but the long-term change in earnings per share (EPS) points to the profitability of that growth – for example, a company could inflate its sales through excessive spending on advertising and promotions.
Although Natera’s full-year earnings are still negative, it reduced its losses and improved its EPS by 12% annually over the last five years. The next few quarters will be critical for assessing its long-term profitability. We hope to see an inflection point soon.
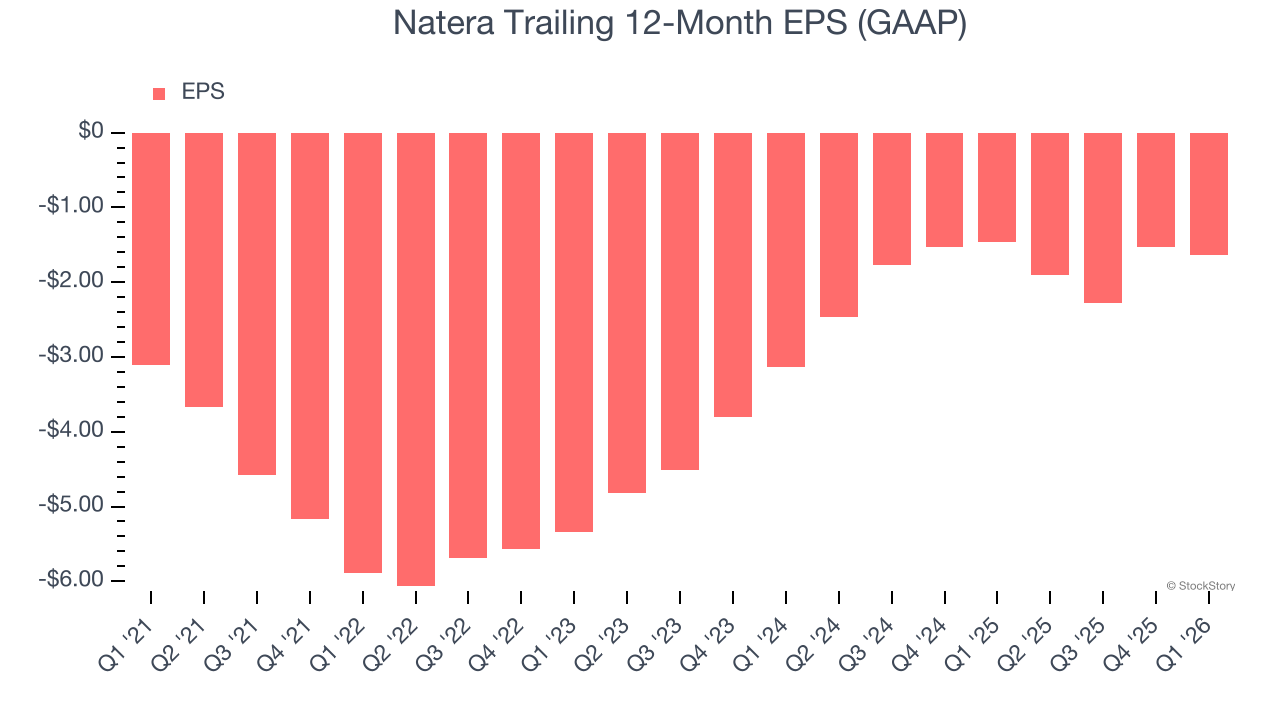
In Q1, Natera reported EPS of negative $0.60, down from negative $0.50 in the same quarter last year. This print missed analysts’ estimates. Over the next 12 months, Wall Street expects Natera to improve its earnings losses. Analysts forecast its full-year EPS of negative $1.64 will advance to negative $1.56.
Key Takeaways from Natera’s Q1 Results
We were impressed by how significantly Natera blew past analysts’ revenue expectations this quarter. On the other hand, its EPS missed. Overall, this print had some key positives. Investors were likely hoping for more, and shares traded down 1.7% to $216.20 immediately after reporting.
Should you buy the stock or not? What happened in the latest quarter matters, but not as much as longer-term business quality and valuation, when deciding whether to invest in this stock. We cover that in our actionable full research report which you can read here (it’s free).
Contact Us
Contact Number :+852 3852 8500Webull Securities Limited is licensed with the Securities and Futures Commission of Hong Kong (CE No. BNG700) for carrying out Type 1 License for Dealing in Securities, Type 2 License for Dealing in Futures Contracts and Type 4 License for Advising on Securities.

English