
Is Trinity Industries (TRN) Upgrading EPS Guidance While Quietly Redefining Its Profitability Narrative?
- Trinity Industries, Inc. reported past first-quarter 2026 results with revenue of US$492.0 million and net income of US$24.2 million, while also lifting full-year 2026 EPS guidance to a range of US$2.20 to US$2.40 excluding non-core items.
- The combination of lower revenue but higher earnings per share points to improved profitability, which underpins management’s confidence in raising earnings expectations for the year.
- Next, we’ll examine how this upgraded EPS outlook and margin improvement may influence Trinity Industries’ existing investment narrative.
Invest in the nuclear renaissance through our list of 91 elite nuclear energy infrastructure plays powering the global AI revolution.
Trinity Industries Investment Narrative Recap
To own Trinity Industries, you need to believe in the long term need for railcar manufacturing and leasing, and the company’s ability to earn attractive returns despite cyclical end markets. The latest quarter showed lower revenue but better profitability and a higher 2026 EPS outlook, which supports the near term catalyst of improving margins, but does not remove the key risk that weaker energy and agriculture demand could still weigh on future order volumes.
The upgraded 2026 EPS guidance to US$2.20 to US$2.40, excluding non core items, is the announcement that most directly ties into this earnings release, as it reflects management’s view of margin resilience after a quarter of softer revenue. For investors tracking catalysts, this raised outlook sits alongside Trinity’s long running dividend record and ongoing buybacks, which together frame how the company is choosing to balance reinvestment and returning capital.
Yet even with stronger margins, investors should be aware of how a downturn in key freight end markets could...
Read the full narrative on Trinity Industries (it's free!)
Trinity Industries' narrative projects $2.7 billion revenue and $141.3 million earnings by 2029.
Uncover how Trinity Industries' forecasts yield a $33.50 fair value, a 9% downside to its current price.
Exploring Other Perspectives
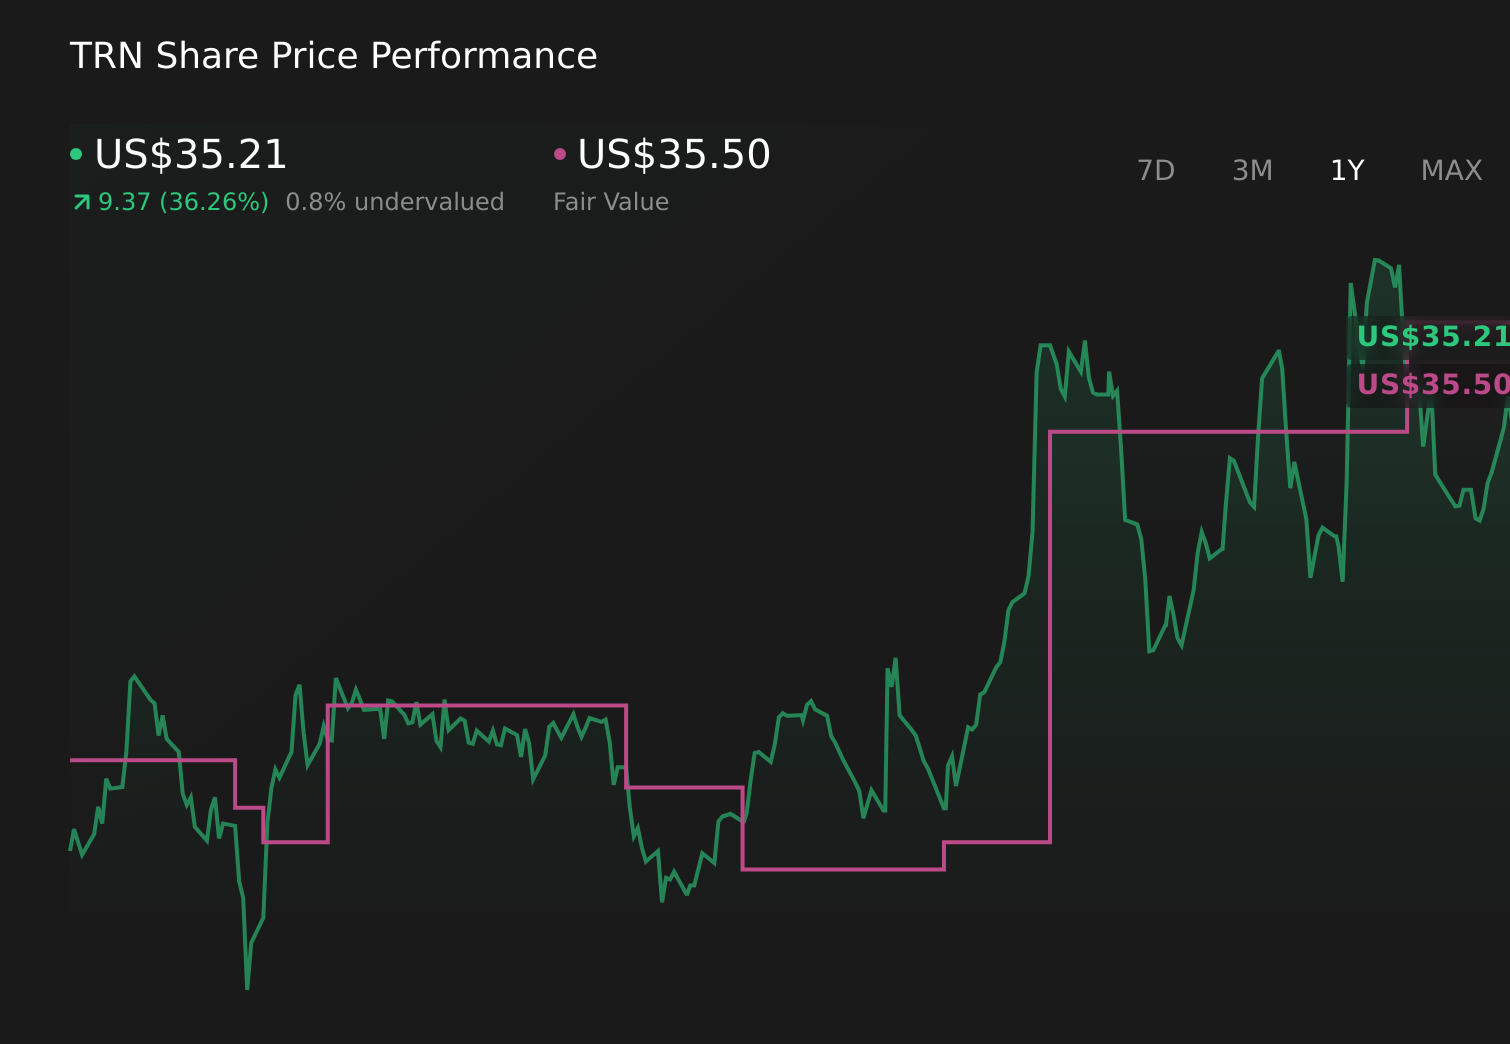
Two fair value estimates from the Simply Wall St Community range from US$21.03 to US$33.50 per share, highlighting very different return expectations. Against this backdrop, the raised EPS guidance and recent margin improvement invite you to weigh how much earnings resilience can offset Trinity’s exposure to cyclical railcar demand.
Explore 2 other fair value estimates on Trinity Industries - why the stock might be worth 43% less than the current price!
Form Your Own Verdict
Don't just follow the ticker - dig into the data and build a conviction that's truly your own.
- A great starting point for your Trinity Industries research is our analysis highlighting 3 key rewards and 4 important warning signs that could impact your investment decision.
- Our free Trinity Industries research report provides a comprehensive fundamental analysis summarized in a single visual - the Snowflake - making it easy to evaluate Trinity Industries' overall financial health at a glance.
Curious About Other Options?
Every day counts. These free picks are already gaining attention. See them before the crowd does:
- The best AI stocks today may lie beyond giants like Nvidia and Microsoft. Find the next big opportunity with these 16 smaller AI-focused companies with strong growth potential through early-stage innovation in machine learning, automation, and data intelligence that could fund your retirement.
- AI is about to change healthcare. These 35 stocks are working on everything from early diagnostics to drug discovery. The best part - they are all under $10b in market cap - there's still time to get in early.
- Uncover the next big thing with 25 elite penny stocks that balance risk and reward.
This article by Simply Wall St is general in nature. We provide commentary based on historical data and analyst forecasts only using an unbiased methodology and our articles are not intended to be financial advice. It does not constitute a recommendation to buy or sell any stock, and does not take account of your objectives, or your financial situation. We aim to bring you long-term focused analysis driven by fundamental data. Note that our analysis may not factor in the latest price-sensitive company announcements or qualitative material. Simply Wall St has no position in any stocks mentioned.
Have feedback on this article? Concerned about the content? Get in touch with us directly. Alternatively, email editorial-team@simplywallst.com
Contact Us
Contact Number :+852 3852 8500Webull Securities Limited is licensed with the Securities and Futures Commission of Hong Kong (CE No. BNG700) for carrying out Type 1 License for Dealing in Securities, Type 2 License for Dealing in Futures Contracts and Type 4 License for Advising on Securities.

English