
Three Stocks That May Be Priced Below Their Estimated Value In May 2026
The United States market has remained flat over the last week but shows an impressive 25% increase over the past year, with earnings forecasted to grow by 17% annually. In such a climate, identifying stocks that may be priced below their estimated value can offer potential opportunities for investors looking to capitalize on growth prospects.
Top 10 Undervalued Stocks Based On Cash Flows In The United States
| Name | Current Price | Fair Value (Est) | Discount (Est) |
| MercadoLibre (MELI) | $1562.00 | $3029.78 | 48.4% |
| Lazard (LAZ) | $45.25 | $88.83 | 49.1% |
| Kaspi.kz (KSPI) | $88.00 | $173.77 | 49.4% |
| Janus Living (JAN) | $27.31 | $54.11 | 49.5% |
| First Merchants (FRME) | $39.45 | $76.20 | 48.2% |
| FinWise Bancorp (FINW) | $13.01 | $25.54 | 49.1% |
| FB Financial (FBK) | $51.35 | $101.61 | 49.5% |
| CVR Energy (CVI) | $33.84 | $67.64 | 50% |
| Coastal Financial (CCB) | $68.225 | $134.79 | 49.4% |
| Bitgo Holdings (BTGO) | $11.91 | $23.08 | 48.4% |
Underneath we present a selection of stocks filtered out by our screen.
Suncrete (RMIX)
Overview: Suncrete, Inc. operates a ready-mix concrete logistics and distribution platform serving construction markets in the United States Sunbelt region, with a market cap of $1.41 billion.
Operations: The company generates revenue from its Cement segment, amounting to $194.87 million.
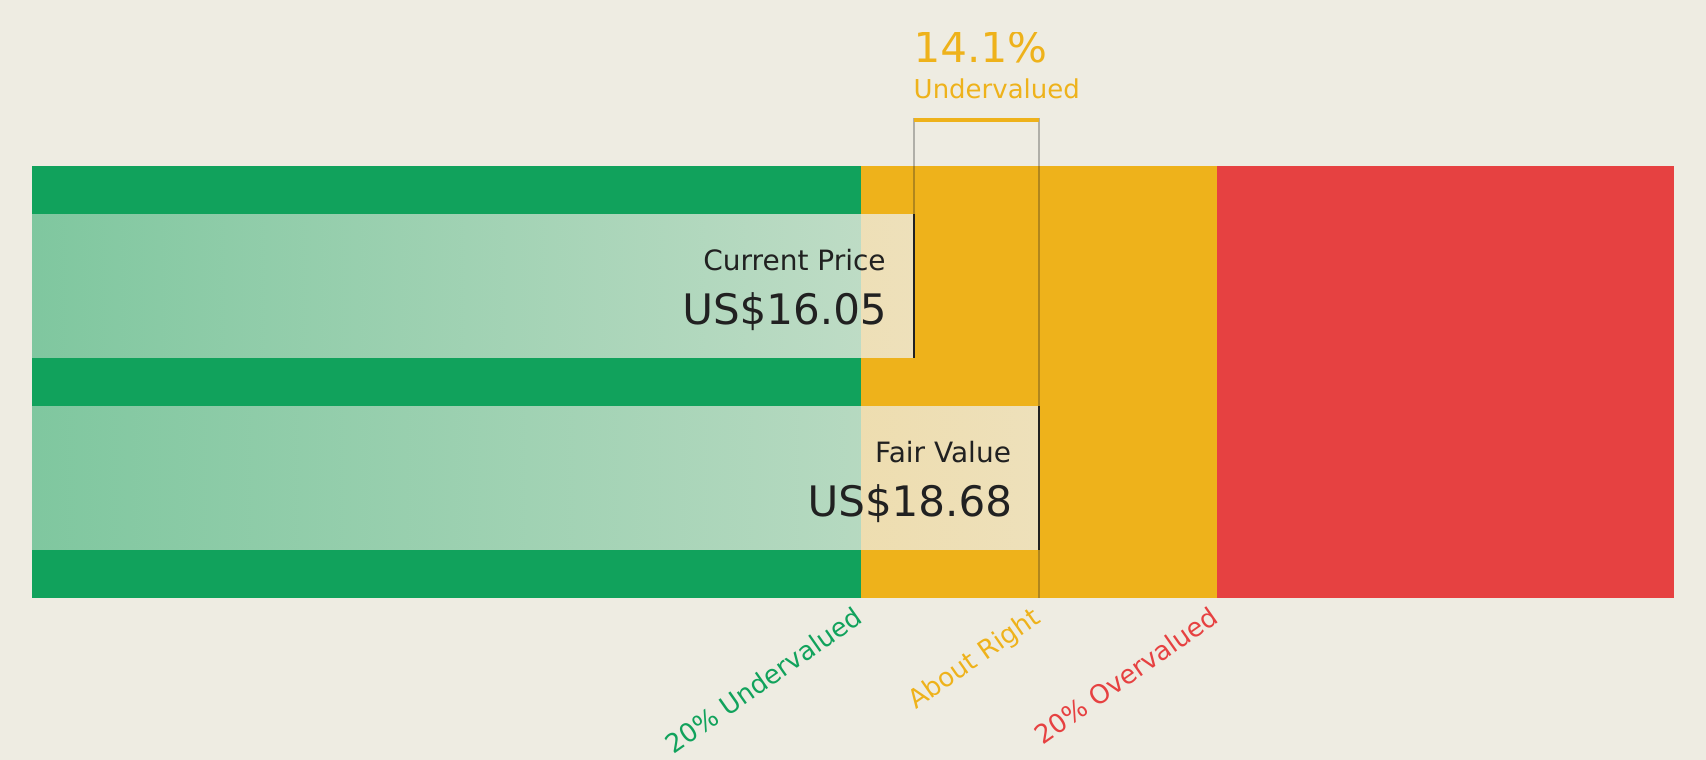
Estimated Discount To Fair Value: 10.8%
Suncrete is trading at 10.8% below its estimated fair value, with revenue expected to grow at 36.2% annually, outpacing the US market average. Despite recent shareholder dilution and a significant drop in net income to US$1.98 million for 2025, earnings are projected to increase by over 50% per year. The company recently filed a shelf registration for $805 million and expanded its board, enhancing governance with experienced directors.
- According our earnings growth report, there's an indication that Suncrete might be ready to expand.
- Click here to discover the nuances of Suncrete with our detailed financial health report.
Harmonic (HLIT)
Overview: Harmonic Inc., along with its subsidiaries, offers broadband access solutions globally and has a market cap of approximately $1.40 billion.
Operations: Harmonic's revenue segments include broadband access solutions provided on a global scale.
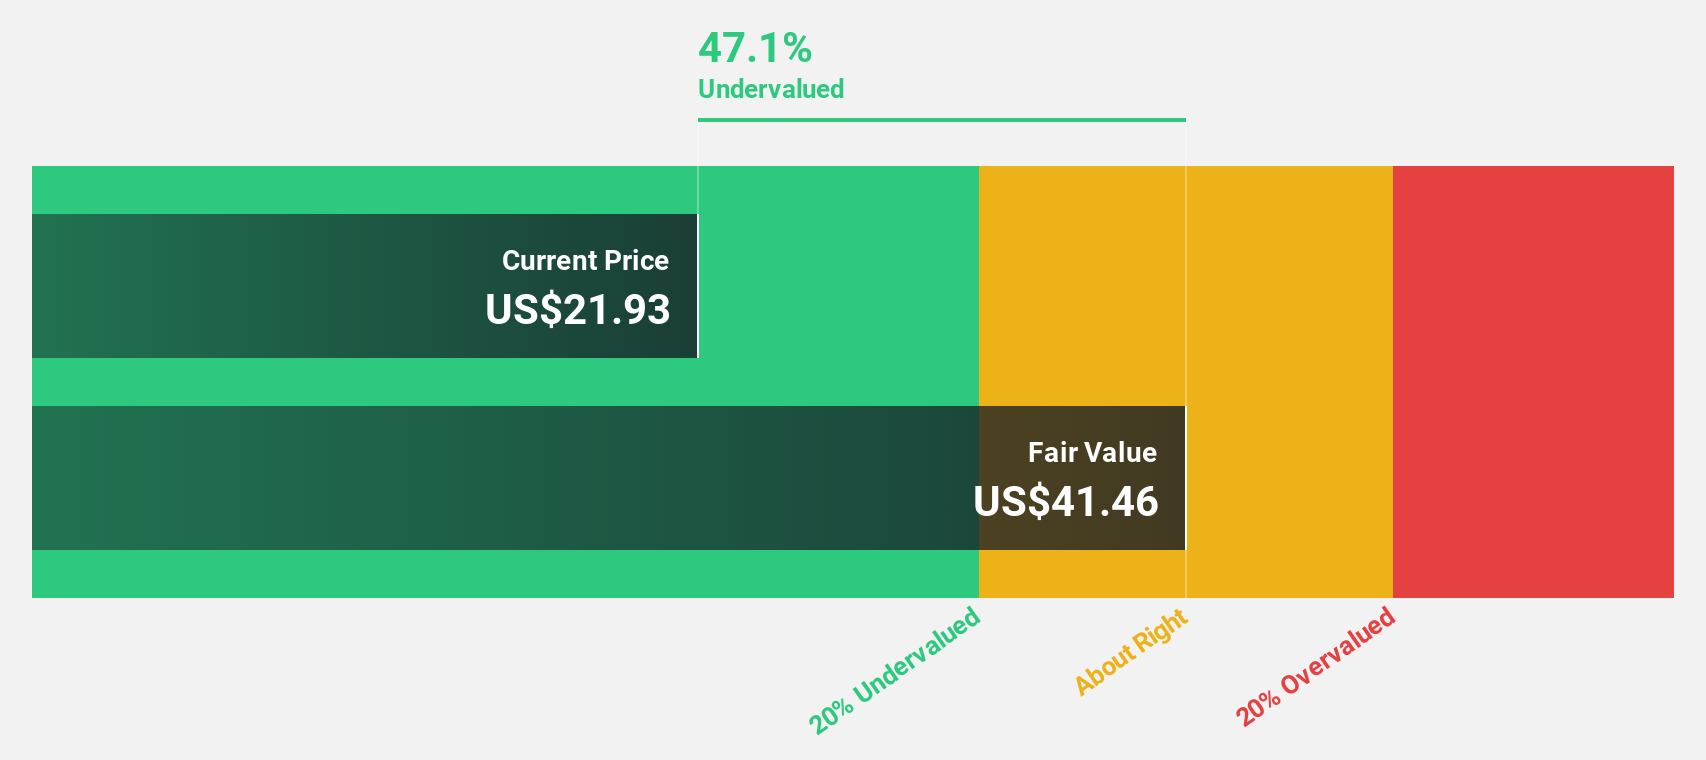
Estimated Discount To Fair Value: 25.8%
Harmonic is trading at 25.8% below its estimated fair value, with earnings forecasted to grow significantly faster than the US market average. Despite a recent decline in profit margins, the company raised its 2026 earnings guidance, expecting net revenue between US$475 million and US$495 million. Harmonic's innovative broadband solutions and strategic partnerships continue to drive operational efficiency and growth potential, positioning it as a strong contender in the broadband technology sector.
- In light of our recent growth report, it seems possible that Harmonic's financial performance will exceed current levels.
- Navigate through the intricacies of Harmonic with our comprehensive financial health report here.
Hesai Group (HSAI)
Overview: Hesai Group develops, manufactures, and sells three-dimensional LiDAR solutions across Mainland China, Europe, North America, and internationally, with a market cap of approximately $3.35 billion.
Operations: The company's revenue primarily comes from the development, manufacturing, and delivery of LiDAR products, amounting to CN¥3.03 billion.
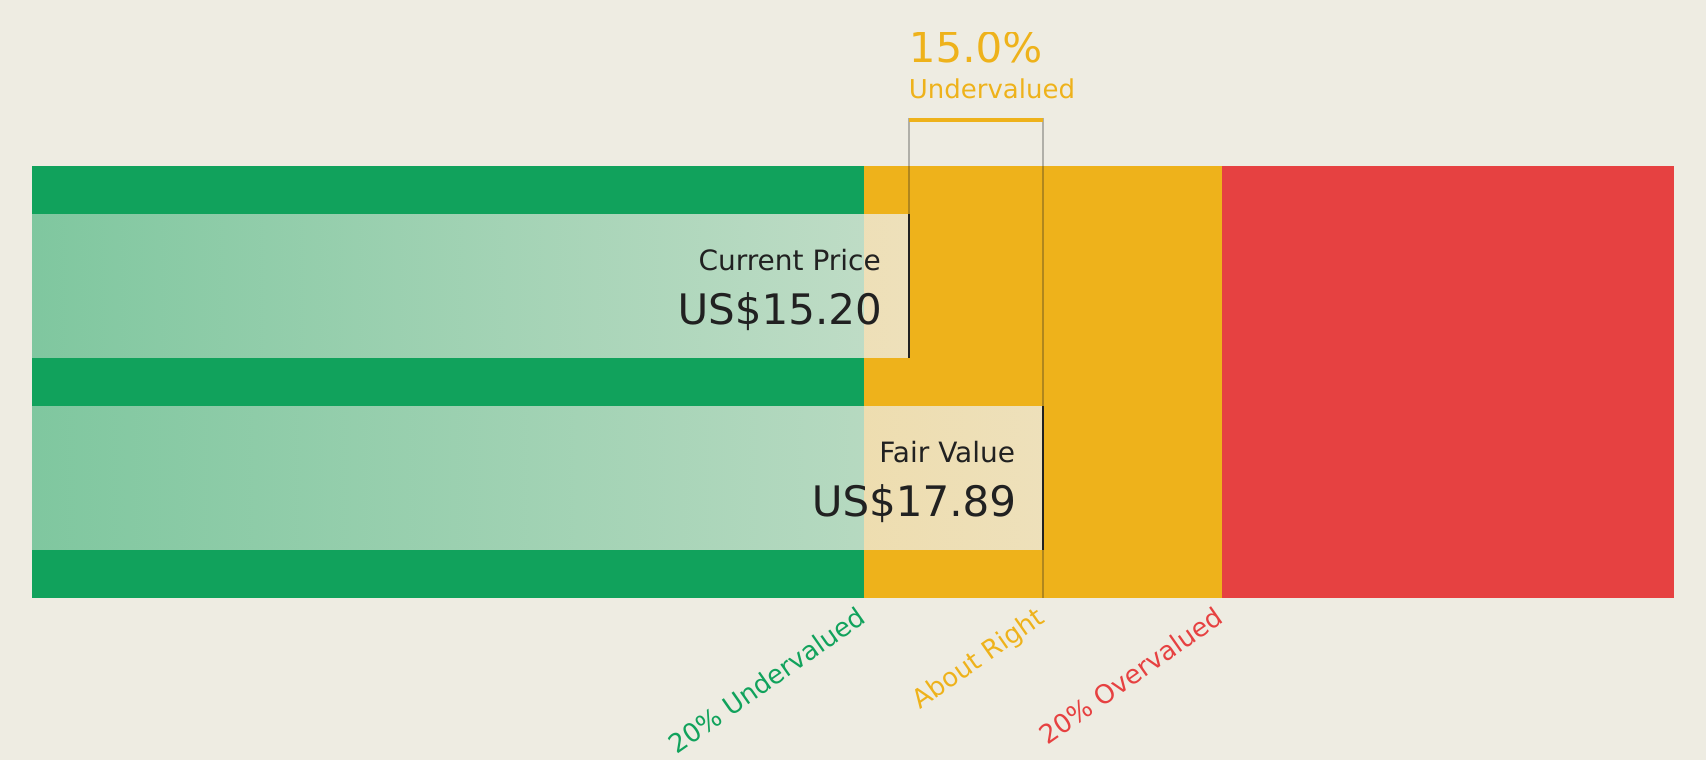
Estimated Discount To Fair Value: 17.8%
Hesai Group is trading at 17.8% below its estimated fair value, with earnings projected to grow significantly above the US market average. The company recently achieved profitability and forecasts a 27.1% annual earnings growth rate over the next three years. Despite a lower forecasted return on equity, Hesai's strategic advancements in lidar technology and partnerships bolster its cash flow potential, positioning it as an intriguing option for investors seeking undervalued stocks based on cash flows.
- Our earnings growth report unveils the potential for significant increases in Hesai Group's future results.
- Click here and access our complete balance sheet health report to understand the dynamics of Hesai Group.
Next Steps
- Gain an insight into the universe of 143 Undervalued US Stocks Based On Cash Flows by clicking here.
- Invested in any of these stocks? Simplify your portfolio management with Simply Wall St and stay ahead with our alerts for any critical updates on your stocks.
- Discover a world of investment opportunities with Simply Wall St's free app and access unparalleled stock analysis across all markets.
Want To Explore Some Alternatives?
- Explore high-performing small cap companies that haven't yet garnered significant analyst attention.
- Diversify your portfolio with solid dividend payers offering reliable income streams to weather potential market turbulence.
- Fuel your portfolio with companies showing strong growth potential, backed by optimistic outlooks both from analysts and management.
This article by Simply Wall St is general in nature. We provide commentary based on historical data and analyst forecasts only using an unbiased methodology and our articles are not intended to be financial advice. It does not constitute a recommendation to buy or sell any stock, and does not take account of your objectives, or your financial situation. We aim to bring you long-term focused analysis driven by fundamental data. Note that our analysis may not factor in the latest price-sensitive company announcements or qualitative material. Simply Wall St has no position in any stocks mentioned.
Have feedback on this article? Concerned about the content? Get in touch with us directly. Alternatively, email editorial-team@simplywallst.com
Contact Us
Contact Number :+852 3852 8500Webull Securities Limited is licensed with the Securities and Futures Commission of Hong Kong (CE No. BNG700) for carrying out Type 1 License for Dealing in Securities, Type 2 License for Dealing in Futures Contracts and Type 4 License for Advising on Securities.

English