
A Look At LandBridge (LB) Valuation As Earnings Growth And M&A Plans Draw Investor Attention
LandBridge earnings and M&A priorities draw investor attention
LandBridge (LB) has drawn fresh attention after first quarter 2026 results showed revenue of $51.01 million and net income of $8.72 million, alongside management’s focus on accretive acquisitions and expanding fee surface ownership.
See our latest analysis for LandBridge.
Following the earnings release and comments on disciplined M&A, LandBridge’s share price has shown strong momentum, with a 1-day share price return of 4.66% and a year-to-date share price return of 56.15%, even though the 1-year total shareholder return declined 8.88%.
If brisk recent gains have you thinking about where else capital is moving, this could be a good moment to scan 35 power grid technology and infrastructure stocks
With revenue and net income growing, a share price up 56.15% year to date, and an intrinsic value estimate implying a 21.37% discount, the key question is whether LandBridge is still undervalued or if the market is already pricing in future growth.
Most Popular Narrative: 6% Undervalued
With LandBridge last closing at $75.67 against a narrative fair value of $80.43, the current setup hinges on how recurring, fee based cash flows scale from here.
LandBridge's capital-light model and focus on long-term, fee-based contracts (e.g., triple-net leases and surface use royalties now making up 94% of revenue) enhance free cash flow generation and lead to greater earnings resiliency, even in periods of commodity price weakness, positively affecting both EBITDA margins and cash flow stability.
Want to see what underpins that confidence in future cash flows? The narrative leans heavily on faster revenue growth, much fatter margins, and a reset in valuation multiples.
Result: Fair Value of $80.43 (UNDERVALUED)
Have a read of the narrative in full and understand what's behind the forecasts.
However, this hinges on timely execution. Delays in projects like DBR Solar or a slowdown in Permian activity could potentially upset the recurring cash flow story.
Find out about the key risks to this LandBridge narrative.
Another View: Rich P/E Keeps Expectations High
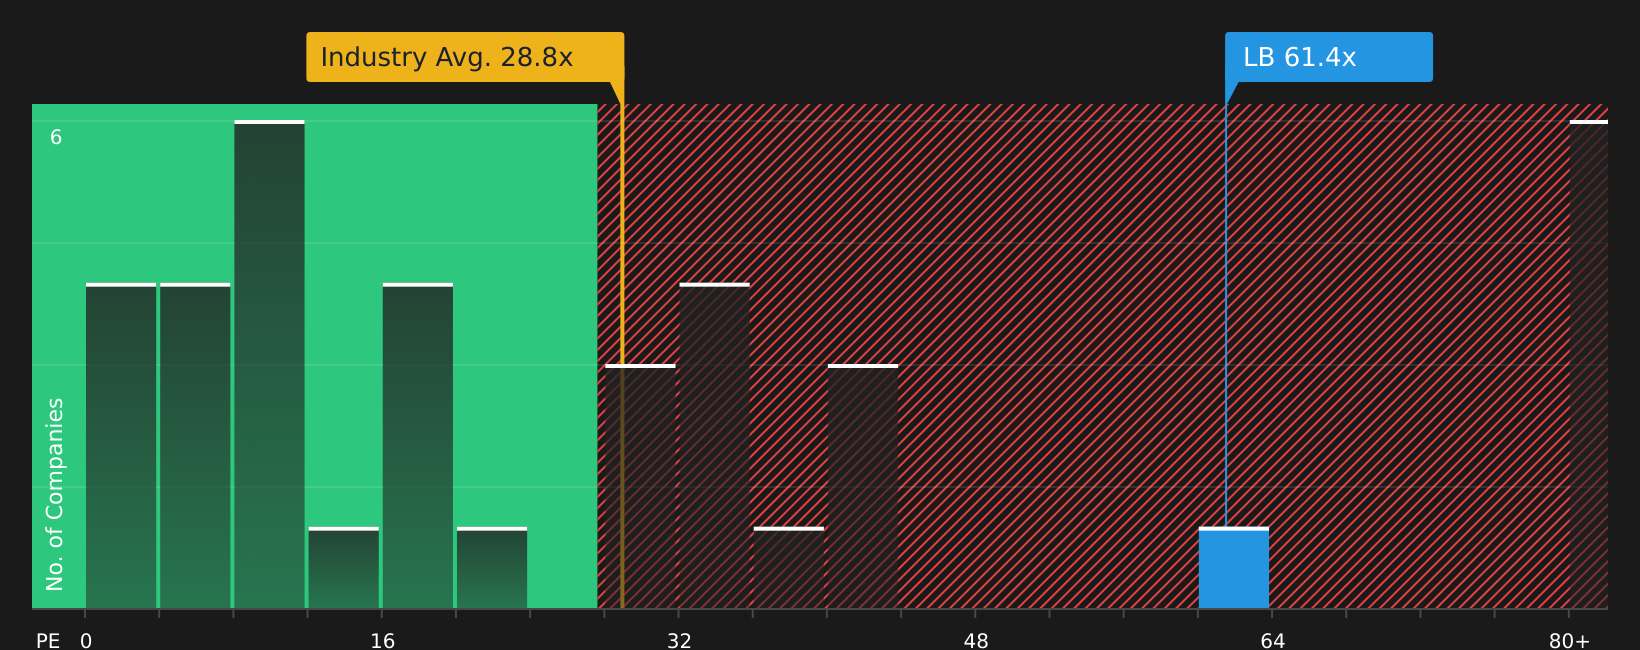
The narrative and DCF style fair value point to LandBridge trading at about a 21.4% discount, yet the stock sits on a P/E of 66.5x versus 30x for the US Real Estate industry and 42.2x for peers, and above its own fair ratio of 42.6x. That gap suggests expectations are already demanding, so how much margin for error is really left?
See what the numbers say about this price — find out in our valuation breakdown.
Next Steps
After weighing both the upbeat and cautious signals, do not just take this narrative at face value; act now to review the full picture with 3 key rewards and 1 important warning sign
Looking for more investment ideas?
Do not stop with a single stock view. Broaden your watchlist with focused ideas that could fit different roles in your portfolio and keep you ahead of the crowd.
- Target potential value opportunities by scanning 54 high quality undervalued stocks that pair solid fundamentals with a price that may not fully reflect them yet.
- Strengthen your income stream by checking out 12 dividend fortresses that offer higher yields while still paying attention to stability.
- Round out your watchlist with 66 resilient stocks with low risk scores that may help balance more volatile positions and smooth your overall portfolio ride.
This article by Simply Wall St is general in nature. We provide commentary based on historical data and analyst forecasts only using an unbiased methodology and our articles are not intended to be financial advice. It does not constitute a recommendation to buy or sell any stock, and does not take account of your objectives, or your financial situation. We aim to bring you long-term focused analysis driven by fundamental data. Note that our analysis may not factor in the latest price-sensitive company announcements or qualitative material. Simply Wall St has no position in any stocks mentioned.
Have feedback on this article? Concerned about the content? Get in touch with us directly. Alternatively, email editorial-team@simplywallst.com
Contact Us
Contact Number :+852 3852 8500Webull Securities Limited is licensed with the Securities and Futures Commission of Hong Kong (CE No. BNG700) for carrying out Type 1 License for Dealing in Securities, Type 2 License for Dealing in Futures Contracts and Type 4 License for Advising on Securities.

English