
A Look At FTAI Aviation (FTAI) Valuation As 2026 Free Cash Flow Outlook Pressures Sentiment
FTAI Aviation (FTAI) is back in focus after investors reacted to a weaker 2026 free cash flow outlook, even as the company moves to redeem its 8.25% Series C preferred shares.
See our latest analysis for FTAI Aviation.
Recent trading has been volatile, with the share price falling 17% over the past 90 days and 6.79% over the past 30 days, while rising 14.02% year to date and delivering a 5-year total shareholder return above 10x. This suggests that long-term momentum remains strong even as the market reassesses cash flow risks and preferred share redemption plans around the current US$239.84 level.
If this kind of sharp move has you looking beyond a single aviation stock, it may be a good time to broaden your search with 20 top founder-led companies
With FTAI Aviation now trading around US$239.84, a reported 30.6% intrinsic discount and a 46.2% gap to analyst targets pull in one direction, while cash flow worries pull in another. This raises the question: is this a true opportunity, or is the market already baking in future growth?
Most Popular Narrative: 6.6% Overvalued
According to the most followed narrative on Simply Wall St, FTAI Aviation's fair value of $225.05 sits below the last close at $239.84, setting up a tight valuation gap that turns on how durable engine demand and margins really are.
FTAI Aviation is not a traditional aircraft lessor. It is evolving into a hybrid aerospace infrastructure and aftermarket platform.
Strengths: structural tailwinds, integrated model, aftermarket margins.
Weaknesses: leverage, concentration, execution complexity.
Key risk: dependence on aging fleet economics holding longer than expected.
Curious how that hybrid model supports a premium price tag? The narrative leans heavily on engine scarcity, expanding aftermarket economics and a punchy future earnings multiple. The exact mix of growth, margins and required returns behind that $225.05 fair value might surprise you.
Result: Fair Value of $225.05 (OVERVALUED)
Have a read of the narrative in full and understand what's behind the forecasts.
However, two pressure points stand out: the company’s leverage and its focus on aging engine platforms could both challenge the premium narrative if conditions turn.
Find out about the key risks to this FTAI Aviation narrative.
Another Angle on Value: Market Ratios vs Fair Ratio
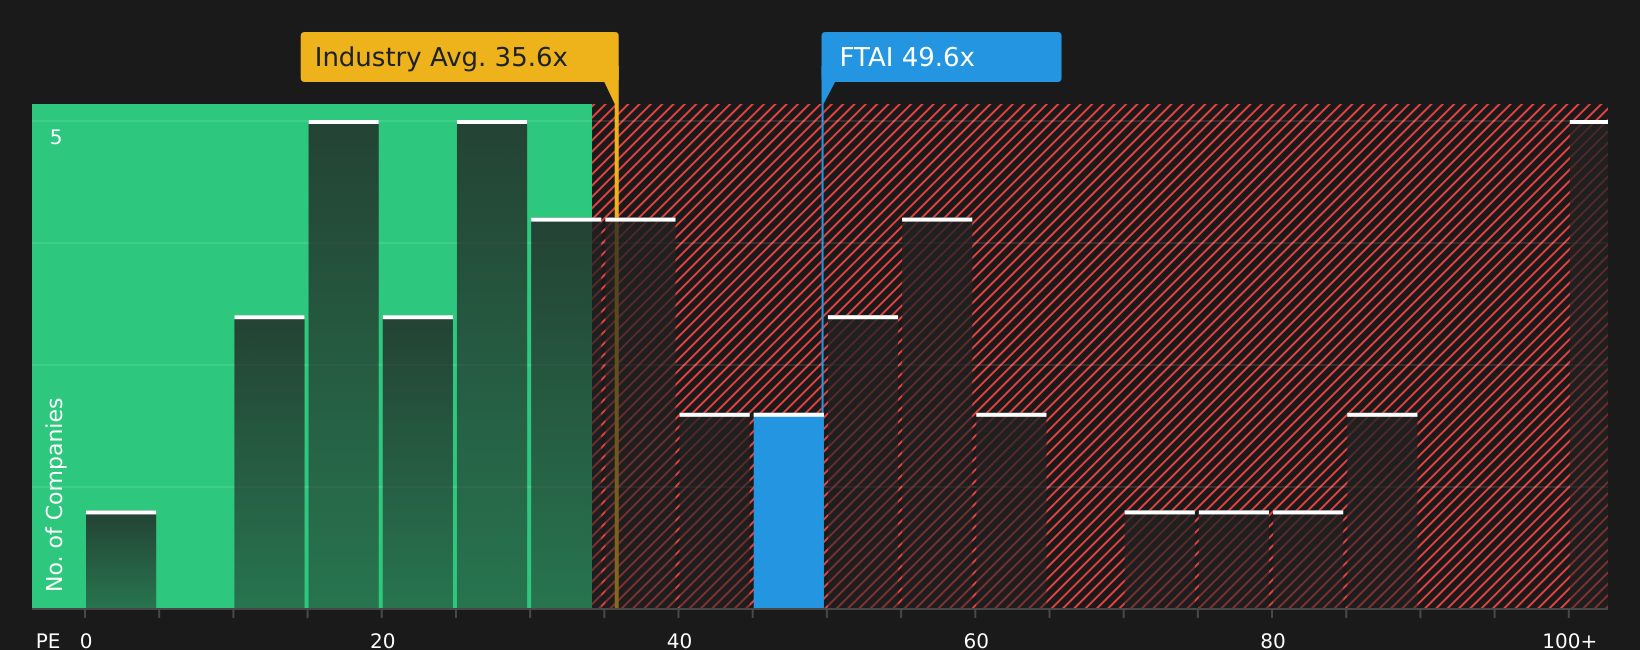
While the user narrative tags FTAI as 6.6% overvalued at $225.05, market ratios paint a mixed picture. The stock trades on a P/E of 47.2x, above the US Aerospace & Defense average of 35.4x, yet below a fair ratio estimate of 58.7x and the peer average of 54.9x. That gap can point to either extra risk being priced in or potential upside if sentiment shifts. Which side do you think the market is leaning toward?
See what the numbers say about this price — find out in our valuation breakdown.
Next Steps
With sentiment this split between risks and rewards, it makes sense to move quickly, test the numbers yourself and decide where you stand using 4 key rewards and 4 important warning signs.
Looking for more investment ideas?
If FTAI Aviation has your attention, do not stop there; broaden your watchlist now so you are not late to the next opportunity emerging on your radar.
- Target potential mispricing by scanning 51 high quality undervalued stocks that pair solid fundamentals with a price that may not fully reflect their underlying business strength.
- Strengthen your income focus by reviewing 10 dividend fortresses that combine higher yields with an emphasis on dependable shareholder payouts.
- Protect your downside by checking 67 resilient stocks with low risk scores that score well on resilience and balance sheet quality so setbacks are less likely to surprise you.
This article by Simply Wall St is general in nature. We provide commentary based on historical data and analyst forecasts only using an unbiased methodology and our articles are not intended to be financial advice. It does not constitute a recommendation to buy or sell any stock, and does not take account of your objectives, or your financial situation. We aim to bring you long-term focused analysis driven by fundamental data. Note that our analysis may not factor in the latest price-sensitive company announcements or qualitative material. Simply Wall St has no position in any stocks mentioned.
Have feedback on this article? Concerned about the content? Get in touch with us directly. Alternatively, email editorial-team@simplywallst.com
Contact Us
Contact Number :+852 3852 8500Webull Securities Limited is licensed with the Securities and Futures Commission of Hong Kong (CE No. BNG700) for carrying out Type 1 License for Dealing in Securities, Type 2 License for Dealing in Futures Contracts and Type 4 License for Advising on Securities.

English