
Is Waters (WAT) Offering Opportunity After Recent Share Price Weakness And Conflicting Valuation Signals
- If you are wondering whether Waters at around US$341 per share looks expensive or appealing, the key is to understand what you are really paying for in the current valuation.
- The stock has inched up 1.9% over the past week and 1.7% over the past month, even though the year to date return is down 10.6% and the 1 year return is down 1.7%. The 3 year and 5 year returns stand at 32.8% and 6.7% respectively.
- Recent coverage has focused on Waters as a long established player in life sciences tools, with investors paying close attention to how its product portfolio and market position support the current share price. This context helps explain why the stock has moved only modestly in the short term, while longer term returns remain more mixed.
- Right now Waters carries a value score of 2 out of 6. This means some valuation checks suggest potential appeal while others are less supportive. The sections that follow break down those methods before turning to a broader way of thinking about what fair value really means for this stock.
Waters scores just 2/6 on our valuation checks. See what other red flags we found in the full valuation breakdown.
Approach 1: Waters Discounted Cash Flow (DCF) Analysis
A Discounted Cash Flow, or DCF, model projects a company’s future cash flows and then discounts them back to today’s value to estimate what the stock might reasonably be worth.
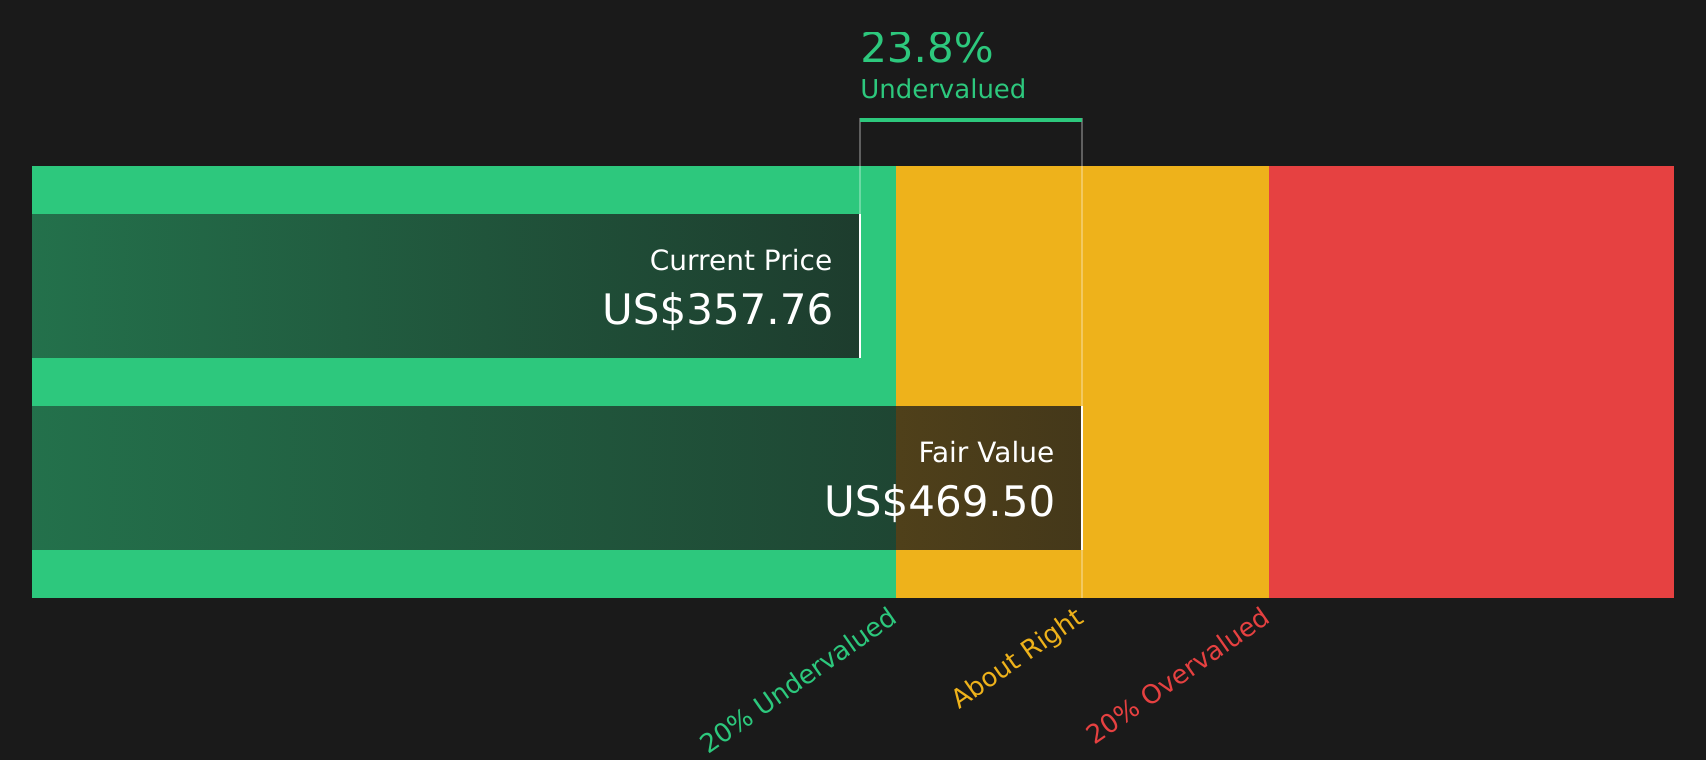
For Waters, the model used is a 2 Stage Free Cash Flow to Equity approach, based on cash flows in $. The latest twelve month free cash flow is about $226.1 million. Analyst estimates and subsequent extrapolations point to free cash flow reaching about $3.2 billion by 2035, with interim projections such as $892.1 million in 2026 and $1.9 billion in 2029. These projected cash flows are then discounted back to today using the DCF framework.
Putting those projected cash flows together, the model arrives at an estimated intrinsic value of about $491.67 per share. Compared with a recent share price around $341, this implies the stock trades at a 30.6% discount to the DCF estimate, indicating potential undervaluation based purely on this cash flow view.
Result: UNDERVALUED
Our Discounted Cash Flow (DCF) analysis suggests Waters is undervalued by 30.6%. Track this in your watchlist or portfolio, or discover 51 more high quality undervalued stocks.
Approach 2: Waters Price vs Earnings
For a profitable company like Waters, the P/E ratio is a straightforward way to see how much you are paying for each dollar of current earnings. Investors usually accept higher P/E ratios when they expect stronger earnings growth or see lower risk, and look for lower P/E ratios when growth expectations are more modest or perceived risk is higher.
Waters currently trades on a P/E of 74.53x. That sits above both the Life Sciences industry average P/E of 35.53x and the peer average of 27.59x. This suggests the stock carries a richer valuation than many comparable companies on this metric alone.
Simply Wall St’s Fair Ratio for Waters comes in at 27.40x. This is a proprietary estimate of what P/E might make sense given factors such as earnings growth profile, profit margins, industry, market cap and company specific risks. Because it blends these drivers, the Fair Ratio can be more tailored than a simple comparison with industry or peer averages.
Comparing the Fair Ratio of 27.40x with the current P/E of 74.53x points to the stock trading above that modelled range. This indicates it screens as overvalued on this earnings multiple view.
Result: OVERVALUED

P/E ratios tell one story, but what if the real opportunity lies elsewhere? Start investing in legacies, not executives. Discover our 20 top founder-led companies.
Upgrade Your Decision Making: Choose your Waters Narrative
Earlier it was mentioned that there is an even better way to understand valuation, so this is where Narratives come in, giving you a clear story behind your assumptions for Waters, from future revenue, earnings and margins through to your fair value estimate.
A Narrative on Simply Wall St is your structured view of the company, where you link the business story to a financial forecast and then to a single fair value number that can be compared directly with today’s share price.
Because Narratives live on the Community page and are used by millions of investors, they are designed to be easy to set up, easy to read, and automatically refresh when new information such as earnings releases or news updates is added to the platform.
For Waters, one investor might align with a higher fair value around US$478 per share and build a story that assumes stronger growth and margins. Another might prefer a cautious fair value around US$330 that reflects more pressure on profitability. By comparing each fair value with the current price, you can decide whether the stock looks closer to fully valued or potentially mispriced under your chosen story.
For Waters however we will make it really easy for you with previews of two leading Waters Narratives:
Fair value in this bullish narrative: about US$478.
Current price vs this fair value: around 29% below that estimate.
Revenue growth assumption: 30.10% a year.
- Assumes rapid uptake of new systems and workflow solutions, with recurring revenue helping to lift margins over time.
- Builds in benefits from the BD Biosciences and Diagnostic Solutions acquisition, including cost synergies and broader customer reach.
- Expects long term demand from drug R&D, biotech, and aging populations to support a larger installed base and higher service and consumables revenue.
Fair value in this bearish narrative: about US$330.
Current price vs this fair value: around 3% above that estimate.
Revenue growth assumption: 34.13% a year.
- Highlights dependence on mature product lines and customer budget constraints, which could limit pricing power over time.
- Flags integration and execution risks around the BD acquisition and the new divisional structure, which could delay expected synergies.
- Points to margin pressure from mix shifts, tariffs, and competition, with some end markets and divisions at risk of weaker or volatile demand.
If you want to see how your own view lines up with these bullish and bearish setups, you can read the full narrative and valuation work behind each one in the Simply Wall St community. See what the community is saying about Waters
Do you think there's more to the story for Waters? Head over to our Community to see what others are saying!

This article by Simply Wall St is general in nature. We provide commentary based on historical data and analyst forecasts only using an unbiased methodology and our articles are not intended to be financial advice. It does not constitute a recommendation to buy or sell any stock, and does not take account of your objectives, or your financial situation. We aim to bring you long-term focused analysis driven by fundamental data. Note that our analysis may not factor in the latest price-sensitive company announcements or qualitative material. Simply Wall St has no position in any stocks mentioned.
Have feedback on this article? Concerned about the content? Get in touch with us directly. Alternatively, email editorial-team@simplywallst.com
Contact Us
Contact Number :+852 3852 8500Webull Securities Limited is licensed with the Securities and Futures Commission of Hong Kong (CE No. BNG700) for carrying out Type 1 License for Dealing in Securities, Type 2 License for Dealing in Futures Contracts and Type 4 License for Advising on Securities.

English