
TransUnion (TRU) Valuation Check As Google YouTube Attribution Partnership Gains Traction
TransUnion (TRU) stock is back in focus after the company and Google introduced a new way for marketers to measure YouTube advertising within TransUnion’s Multi Touch Attribution solution, tying video ad exposure directly to business outcomes.
See our latest analysis for TransUnion.
At a share price of US$70.66, TransUnion’s 1-day and 7-day share price returns of 1.71% and 6.64% stand in contrast to a year-to-date share price decline of 15.20% and a 1-year total shareholder return decline of 14.65%. This suggests recent momentum is picking up after a weaker stretch, as the Google partnership, dividend declaration and ongoing legal action shape how investors weigh growth potential against risk.
If this kind of data driven marketing story interests you, it can be worth widening the lens and checking out 63 profitable AI stocks that aren't just burning cash
So with TransUnion’s share price down so far this year, but trading at a discount to analyst targets and with some growth drivers on the table, is the stock undervalued today or already pricing in future growth?
Most Popular Narrative: 22.6% Undervalued
TransUnion's most followed narrative pegs fair value at $91.33 per share, compared with the latest close at $70.66. This frames a sizable valuation gap built on detailed earnings and cash flow expectations that run well beyond the near term headline news.
With technology modernization and operational transformation investments ending in 2025, management projects free cash flow conversion to rise significantly (from 70% in 2025 to 90%+ in 2026), providing a catalyst for future shareholder returns through buybacks, acquisitions, or reinvestment, and supporting a step-change in long-term earnings growth.
Want the full story behind that valuation gap? The narrative leans on steady revenue expansion, firmer margins, and a richer future earnings multiple. Curious which assumptions really carry the model and how sensitive that $91.33 figure is to small tweaks in growth or profitability? The next step is seeing how all those moving parts fit together.
Result: Fair Value of $91.33 (UNDERVALUED)
Have a read of the narrative in full and understand what's behind the forecasts.
However, you still need to weigh that upside case against tighter data regulation or a major cyber breach, either of which could quickly affect revenue, costs and sentiment.
Find out about the key risks to this TransUnion narrative.
Another View: What The P/E Ratio Is Saying
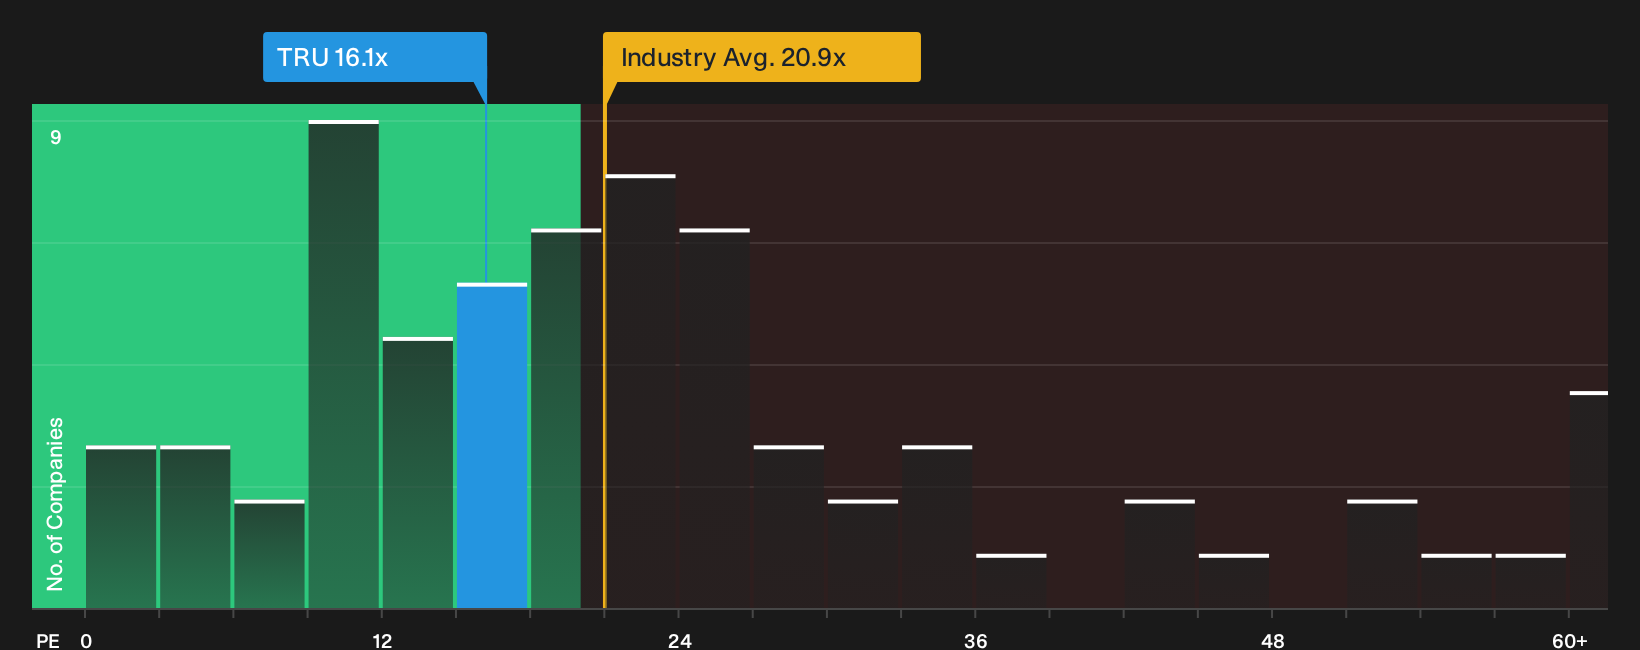
That 22.6% “undervalued” fair value hinges on detailed earnings and cash flow forecasts, but the current P/E of 19.3x tells a more measured story. It lines up exactly with the US Professional Services industry average of 19.3x and sits below the peer average of 23.2x, while our fair ratio is slightly higher at 21.6x. In practice, that points to some room for the market to re rate the stock if sentiment improves, but also suggests less of a clear-cut bargain than the headline discount implies. Which signal do you put more weight on?
For a closer look at how earnings multiples stack up against peers and where the fair ratio suggests the market could drift over time, See what the numbers say about this price — find out in our valuation breakdown.
Next Steps
With sentiment pulled between risks and rewards, the next move is yours. Act while the data is fresh and weigh up the 4 key rewards and 2 important warning signs
Looking for more investment ideas?
If you are serious about building a stronger portfolio, do not stop at one stock. Use focused tools to spot opportunities that others might easily overlook.
- Spot potential value early by checking out screener containing 21 high quality undiscovered gems that combine solid fundamentals with under-the-radar market attention.
- Strengthen your income stream by reviewing 10 dividend fortresses that aim for higher yields with a focus on resilience.
- Cut down on unpleasant surprises by scanning 67 resilient stocks with low risk scores designed to prioritize stability and lower risk scores.
This article by Simply Wall St is general in nature. We provide commentary based on historical data and analyst forecasts only using an unbiased methodology and our articles are not intended to be financial advice. It does not constitute a recommendation to buy or sell any stock, and does not take account of your objectives, or your financial situation. We aim to bring you long-term focused analysis driven by fundamental data. Note that our analysis may not factor in the latest price-sensitive company announcements or qualitative material. Simply Wall St has no position in any stocks mentioned.
Have feedback on this article? Concerned about the content? Get in touch with us directly. Alternatively, email editorial-team@simplywallst.com
Contact Us
Contact Number :+852 3852 8500Webull Securities Limited is licensed with the Securities and Futures Commission of Hong Kong (CE No. BNG700) for carrying out Type 1 License for Dealing in Securities, Type 2 License for Dealing in Futures Contracts and Type 4 License for Advising on Securities.

English