
3 Asian Stocks Estimated To Be Up To 43.2% Below Intrinsic Value
As global markets respond to geopolitical developments and economic indicators, Asian equities present intriguing opportunities, particularly in the context of fluctuating oil prices and AI-driven technological advancements. In this environment, identifying undervalued stocks that are trading below their intrinsic value can offer potential for growth as investors seek to capitalize on market inefficiencies.
Top 10 Undervalued Stocks Based On Cash Flows In Asia
| Name | Current Price | Fair Value (Est) | Discount (Est) |
| Vista Group International (NZSE:VGL) | NZ$2.27 | NZ$4.53 | 49.9% |
| Strike Group (TSE:6196) | ¥1215.00 | ¥2392.12 | 49.2% |
| STI (KOSDAQ:A039440) | ₩29650.00 | ₩57889.45 | 48.8% |
| Sansan (TSE:4443) | ¥1560.00 | ¥3048.41 | 48.8% |
| Rayhoo Motor DiesLtd (SZSE:002997) | CN¥29.69 | CN¥57.83 | 48.7% |
| Pan-United (SGX:P52) | SGD1.47 | SGD2.93 | 49.8% |
| Nanjing Vazyme Biotech (SHSE:688105) | CN¥13.30 | CN¥26.29 | 49.4% |
| Innovent Biologics (SEHK:1801) | HK$76.40 | HK$151.38 | 49.5% |
| HD-Hyundai Marine Engine (KOSE:A071970) | ₩67100.00 | ₩131828.52 | 49.1% |
| China XLX Fertiliser (SEHK:1866) | HK$10.00 | HK$19.85 | 49.6% |
Here we highlight a subset of our preferred stocks from the screener.
Shanghai Chicmax Cosmetic (SEHK:2145)
Overview: Shanghai Chicmax Cosmetic Co., Ltd. is a multi-brand cosmetics company involved in the research, development, manufacture, and sale of cosmetic products both in Mainland China and internationally, with a market cap of HK$14.60 billion.
Operations: The company's revenue primarily comes from the manufacture and sale of cosmetic products, amounting to CN¥9.18 billion.
Estimated Discount To Fair Value: 15%
Shanghai Chicmax Cosmetic appears undervalued based on cash flow analysis, trading at HK$36.66 below its estimated future cash flow value of HK$43.12. The company's earnings and revenue are forecast to grow faster than the Hong Kong market, with a 16.7% annual earnings growth rate expected. Recent strategic alliances aim to diversify product lines in cosmetics, enhancing its market position despite an unstable dividend track record and only moderate undervaluation compared to peers.
- Our earnings growth report unveils the potential for significant increases in Shanghai Chicmax Cosmetic's future results.
- Navigate through the intricacies of Shanghai Chicmax Cosmetic with our comprehensive financial health report here.
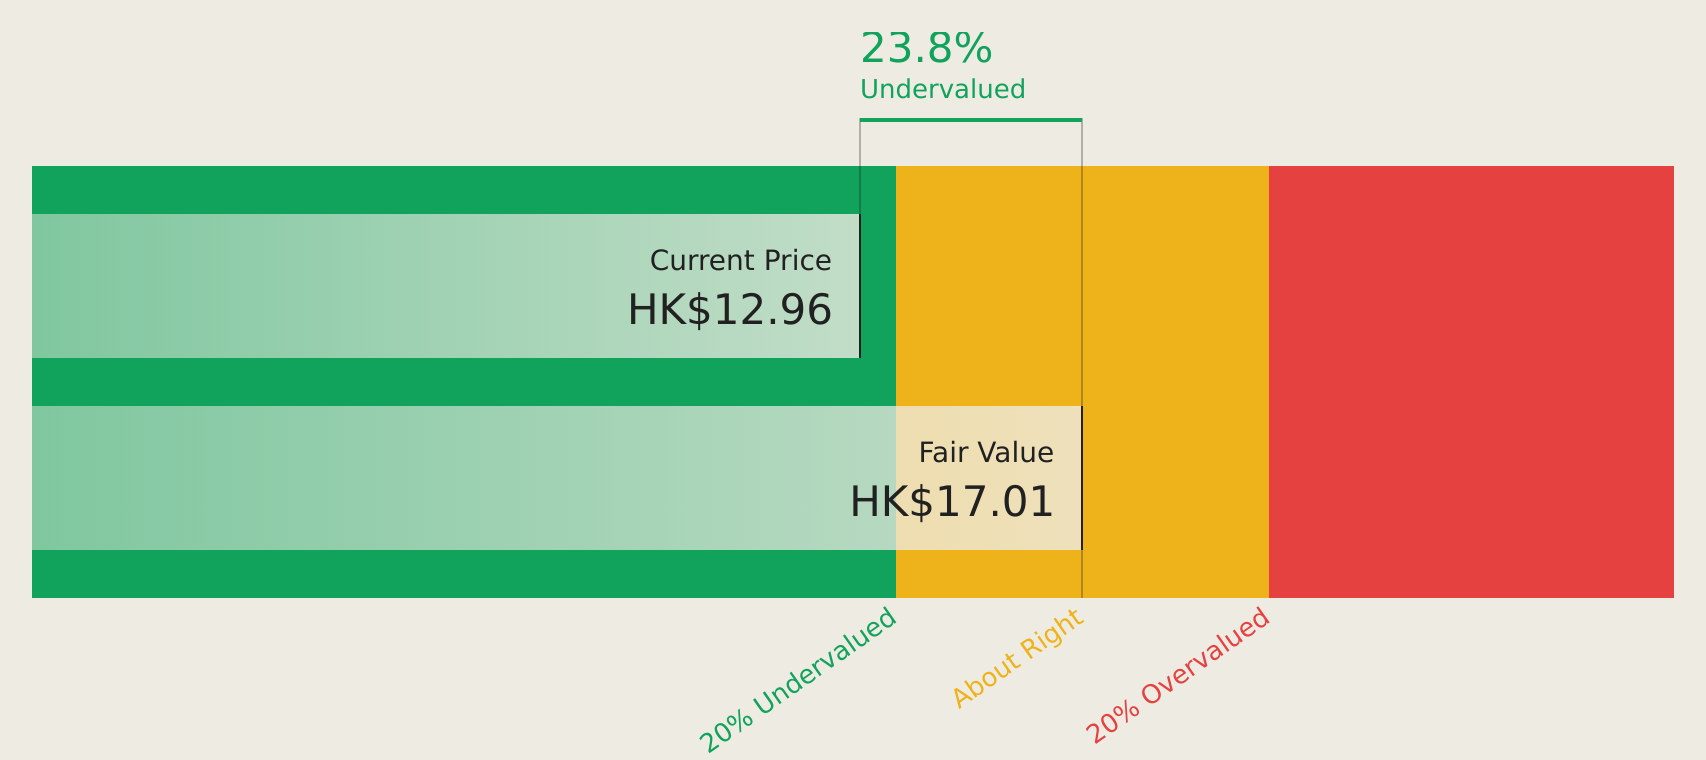
Bank of East Asia (SEHK:23)
Overview: The Bank of East Asia, Limited, along with its subsidiaries, offers a range of banking and financial services and has a market capitalization of approximately HK$36.49 billion.
Operations: The company's revenue segments include Mainland China Operations (HK$3.53 billion), Overseas, Macau and Taiwan operations (HK$2.28 billion), Hong Kong Operations - Personal Banking (HK$6.87 billion), Treasury Markets (HK$1.62 billion), and Wealth Management (HK$1.31 billion).
Estimated Discount To Fair Value: 17.9%
Bank of East Asia trades at HK$13.81, below its estimated future cash flow value of HK$16.83, indicating undervaluation based on cash flows. Earnings are forecast to grow significantly at 23.6% annually, outpacing the Hong Kong market's growth rate. Despite a low allowance for bad loans and a high level of non-performing loans at 2.7%, recent fixed-income offerings may enhance liquidity and financial flexibility amidst an unstable dividend track record.
- In light of our recent growth report, it seems possible that Bank of East Asia's financial performance will exceed current levels.
- Delve into the full analysis health report here for a deeper understanding of Bank of East Asia.
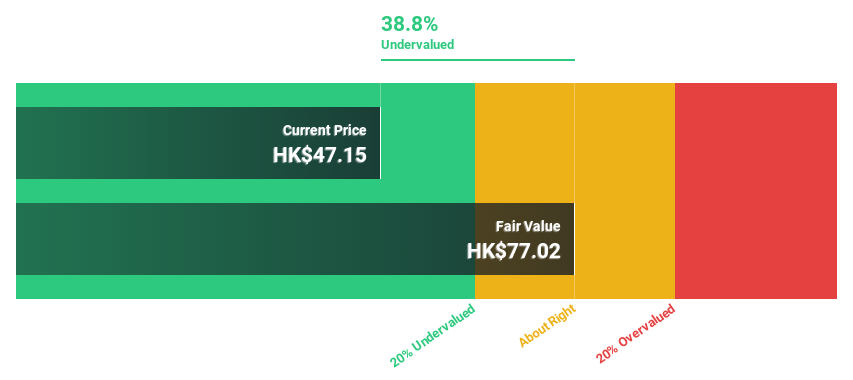
Shenzhen Edge Medical (SEHK:2675)
Overview: Shenzhen Edge Medical Co., Ltd. designs, develops, manufactures, and sells surgical robots in Europe and China, with a market cap of HK$20.06 billion.
Operations: The company generates revenue of CN¥455.72 million from its Surgical & Medical Equipment segment.
Estimated Discount To Fair Value: 43.2%
Shenzhen Edge Medical is trading at HK$53.35, significantly below its estimated future cash flow value of HK$93.85, suggesting undervaluation based on cash flows. Revenue grew by 184.8% last year and is forecast to increase by 33% annually, outpacing the Hong Kong market average. While currently unprofitable with a net loss of CNY 88.61 million in 2025, profitability is expected within three years with earnings projected to grow substantially at 87.86% per year.
- The growth report we've compiled suggests that Shenzhen Edge Medical's future prospects could be on the up.
- Click to explore a detailed breakdown of our findings in Shenzhen Edge Medical's balance sheet health report.
Turning Ideas Into Actions
- Get an in-depth perspective on all 173 Undervalued Asian Stocks Based On Cash Flows by using our screener here.
- Are any of these part of your asset mix? Tap into the analytical power of Simply Wall St's portfolio to get a 360-degree view on how they're shaping up.
- Simply Wall St is your key to unlocking global market trends, a free user-friendly app for forward-thinking investors.
Want To Explore Some Alternatives?
- Explore high-performing small cap companies that haven't yet garnered significant analyst attention.
- Diversify your portfolio with solid dividend payers offering reliable income streams to weather potential market turbulence.
- Fuel your portfolio with companies showing strong growth potential, backed by optimistic outlooks both from analysts and management.
This article by Simply Wall St is general in nature. We provide commentary based on historical data and analyst forecasts only using an unbiased methodology and our articles are not intended to be financial advice. It does not constitute a recommendation to buy or sell any stock, and does not take account of your objectives, or your financial situation. We aim to bring you long-term focused analysis driven by fundamental data. Note that our analysis may not factor in the latest price-sensitive company announcements or qualitative material. Simply Wall St has no position in any stocks mentioned.
Have feedback on this article? Concerned about the content? Get in touch with us directly. Alternatively, email editorial-team@simplywallst.com
Contact Us
Contact Number :+852 3852 8500Webull Securities Limited is licensed with the Securities and Futures Commission of Hong Kong (CE No. BNG700) for carrying out Type 1 License for Dealing in Securities, Type 2 License for Dealing in Futures Contracts and Type 4 License for Advising on Securities.

English