
Coastal Financial And 2 Additional Stocks Estimated To Be Priced Below Intrinsic Value
Over the last 7 days, the United States market has dropped 3.3%, yet it remains up 22% over the past year with earnings forecasted to grow by 17% annually. In this fluctuating environment, identifying stocks that are potentially priced below their intrinsic value can offer opportunities for investors seeking long-term growth, such as Coastal Financial and two other noteworthy companies.
Top 10 Undervalued Stocks Based On Cash Flows In The United States
| Name | Current Price | Fair Value (Est) | Discount (Est) |
| Solstice Advanced Materials (SOLS) | $80.28 | $154.84 | 48.2% |
| Rayonier (RYN) | $20.98 | $40.81 | 48.6% |
| Luckin Coffee (LKNC.Y) | $31.20 | $61.77 | 49.5% |
| Live Oak Bancshares (LOB) | $38.63 | $74.21 | 47.9% |
| Kingstone Companies (KINS) | $15.76 | $31.31 | 49.7% |
| Inter & Co (INTR) | $5.67 | $10.86 | 47.8% |
| Cactus (WHD) | $58.00 | $111.09 | 47.8% |
| BillionToOne (BLLN) | $102.39 | $203.29 | 49.6% |
| Alkami Technology (ALKT) | $15.31 | $29.64 | 48.3% |
| AbbVie (ABBV) | $225.42 | $442.83 | 49.1% |
Here's a peek at a few of the choices from the screener.
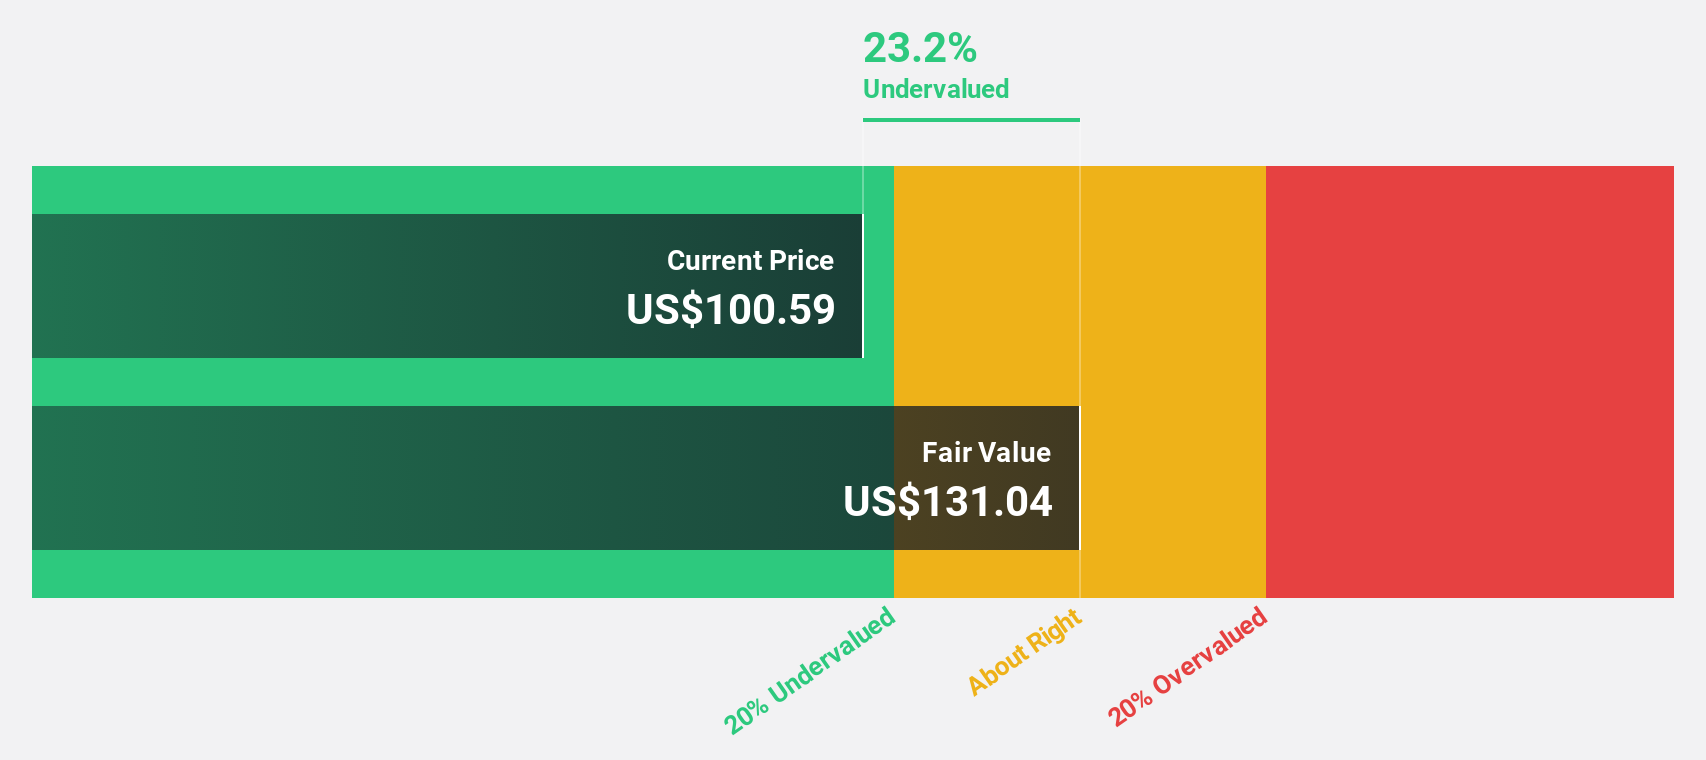
Coastal Financial (CCB)
Overview: Coastal Financial Corporation, with a market cap of $1.08 billion, operates as the bank holding company for Coastal Community Bank, offering a range of banking products and services to consumers and small to medium-sized businesses in the Puget Sound region in Washington.
Operations: Coastal Financial's revenue is primarily derived from three segments: CCBX ($255.45 million), Community Bank ($90.69 million), and Treasury & Administration ($17.18 million).
Estimated Discount To Fair Value: 46.8%
Coastal Financial Corporation's recent earnings report shows net interest income rising to US$83.36 million, with net income at US$12.02 million, reflecting solid financial performance. Despite charge-offs of US$49.59 million, the company is trading at 46.8% below its estimated fair value and significantly below future cash flow value by more than 20%. Analysts forecast strong revenue and earnings growth exceeding market averages, indicating potential undervaluation based on cash flows.
- Our earnings growth report unveils the potential for significant increases in Coastal Financial's future results.
- Delve into the full analysis health report here for a deeper understanding of Coastal Financial.
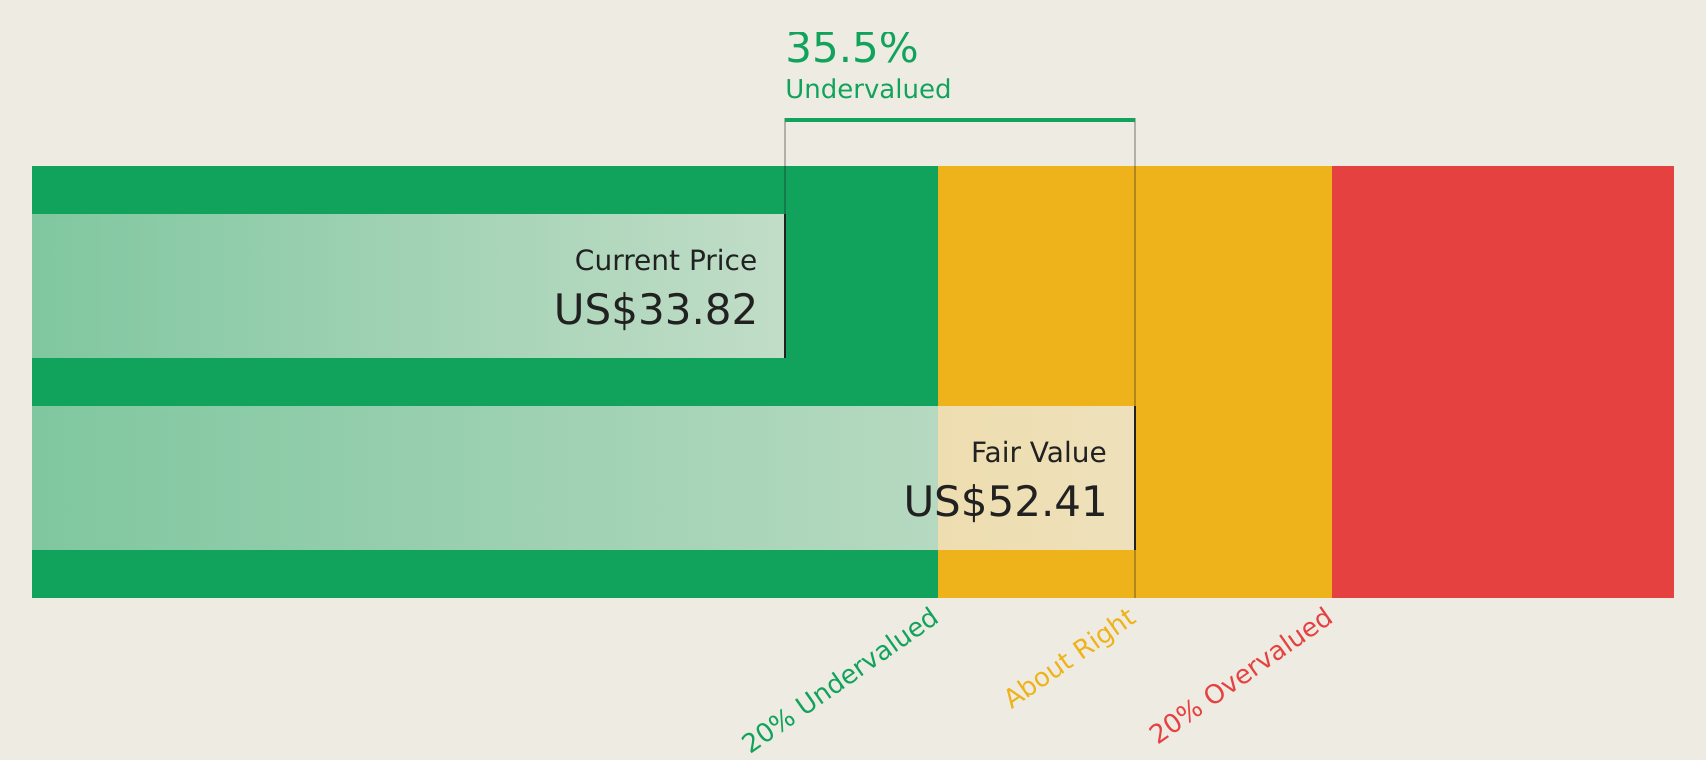
Perimeter Solutions (PRM)
Overview: Perimeter Solutions, Inc. manufactures and supplies firefighting products, electronic components, lubricant additives, and engineered machinery in the United States, Germany, and internationally with a market cap of $5.07 billion.
Operations: The company's revenue segments include Fire Safety, generating $497.22 million, and Specialty Products, contributing $208.68 million.
Estimated Discount To Fair Value: 37.2%
Perimeter Solutions reported Q1 sales of US$125.07 million and net income of US$72.94 million, showing strong financial performance. The company trades at 37.2% below its estimated fair value and significantly below future cash flow value by more than 20%. Analysts expect earnings to grow significantly, with revenue growth forecasted at 15.2% annually, outpacing the broader market. Despite recent insider selling, Perimeter remains focused on strategic acquisitions to enhance operational efficiencies and create shareholder value.
- The analysis detailed in our Perimeter Solutions growth report hints at robust future financial performance.
- Unlock comprehensive insights into our analysis of Perimeter Solutions stock in this financial health report.
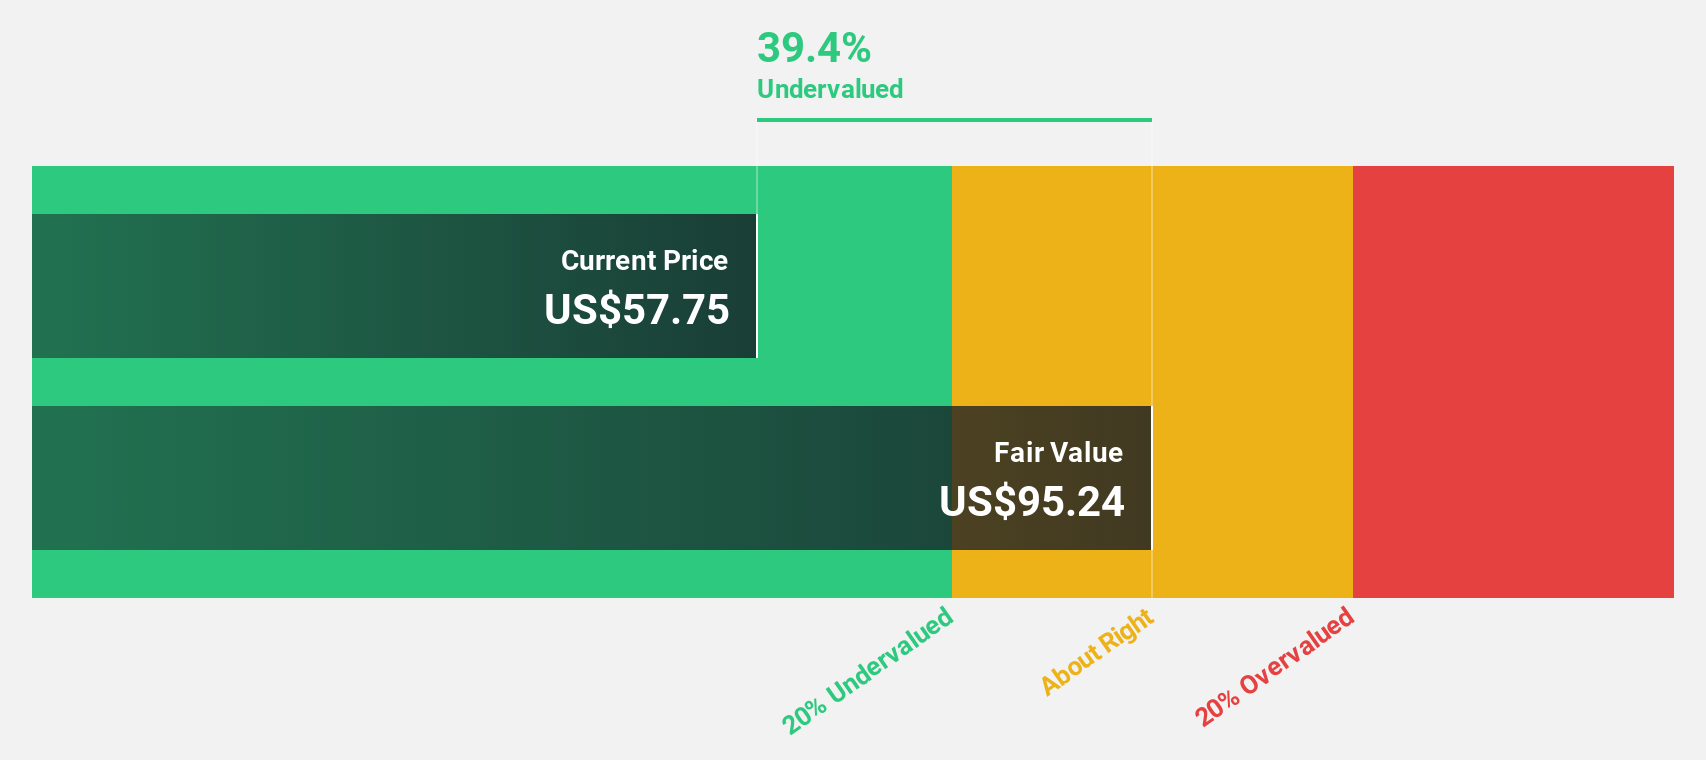
Viking Holdings (VIK)
Overview: Viking Holdings Ltd operates in the passenger cruise industry across North America, the United Kingdom, and internationally, with a market cap of $39.73 billion.
Operations: The company generates revenue from its Viking Ocean and Viking River segments, contributing $2.97 billion and $3.11 billion respectively.
Estimated Discount To Fair Value: 41.7%
Viking Holdings' current stock price of US$90.31 is significantly below its estimated future cash flow value of US$154.8, indicating potential undervaluation. Despite high debt levels and recent insider selling, the company shows promising growth prospects with forecasted annual earnings growth of 18.81% and revenue growth outpacing the broader market at 12.9%. Recent product expansions and executive changes may further bolster Viking's strategic positioning in the competitive cruise industry landscape.
- Upon reviewing our latest growth report, Viking Holdings' projected financial performance appears quite optimistic.
- Get an in-depth perspective on Viking Holdings' balance sheet by reading our health report here.
Where To Now?
- Reveal the 138 hidden gems among our Undervalued US Stocks Based On Cash Flows screener with a single click here.
- Invested in any of these stocks? Simplify your portfolio management with Simply Wall St and stay ahead with our alerts for any critical updates on your stocks.
- Invest smarter with the free Simply Wall St app providing detailed insights into every stock market around the globe.
Contemplating Other Strategies?
- Explore high-performing small cap companies that haven't yet garnered significant analyst attention.
- Diversify your portfolio with solid dividend payers offering reliable income streams to weather potential market turbulence.
- Fuel your portfolio with companies showing strong growth potential, backed by optimistic outlooks both from analysts and management.
This article by Simply Wall St is general in nature. We provide commentary based on historical data and analyst forecasts only using an unbiased methodology and our articles are not intended to be financial advice. It does not constitute a recommendation to buy or sell any stock, and does not take account of your objectives, or your financial situation. We aim to bring you long-term focused analysis driven by fundamental data. Note that our analysis may not factor in the latest price-sensitive company announcements or qualitative material. Simply Wall St has no position in any stocks mentioned.
Have feedback on this article? Concerned about the content? Get in touch with us directly. Alternatively, email editorial-team@simplywallst.com
Contact Us
Contact Number :+852 3852 8500Webull Securities Limited is licensed with the Securities and Futures Commission of Hong Kong (CE No. BNG700) for carrying out Type 1 License for Dealing in Securities, Type 2 License for Dealing in Futures Contracts and Type 4 License for Advising on Securities.

English