
Has The Recent Surge Left F5 (FFIV) Fully Priced Or Is There Still Upside?
- Wondering if F5 at around US$393.84 is still offering value, or if the easy money has already been made? This article focuses on what the current price really implies about the stock.
- F5 has pulled back around 3.6% over the past week, after rising 10.9% over the last 30 days, 53.5% year to date, and 35.0% over the past year, which can change how you think about both opportunity and risk.
- These moves are set against ongoing interest in F5 as a key technology player, with recent coverage highlighting the stock's strong multi year share price performance and its role in critical networking and application security solutions. News has also focused on how investors are reassessing established tech companies that underpin core internet and cloud infrastructure, a group that includes F5.
- On Simply Wall St's valuation framework, F5 scores 3 out of 6 on its value checks. You can see the detailed breakdown in the valuation score. This sets up a closer look at DCF and multiples next, as well as a more complete way to think about fair value at the end of this article.
Find out why F5's 35.0% return over the last year is lagging behind its peers.
Approach 1: F5 Discounted Cash Flow (DCF) Analysis
A Discounted Cash Flow model estimates what a stock could be worth by projecting the company’s future cash flows and discounting them back to today’s value using a required rate of return.
For F5, the model uses a 2 Stage Free Cash Flow to Equity approach. The latest twelve month Free Cash Flow is about $967.8 million. Analyst forecasts and Simply Wall St extrapolations point to projected Free Cash Flow of $1,342.0 million in 2029, with a full set of annual projections out to 2035 used to build the valuation. All figures are in $.
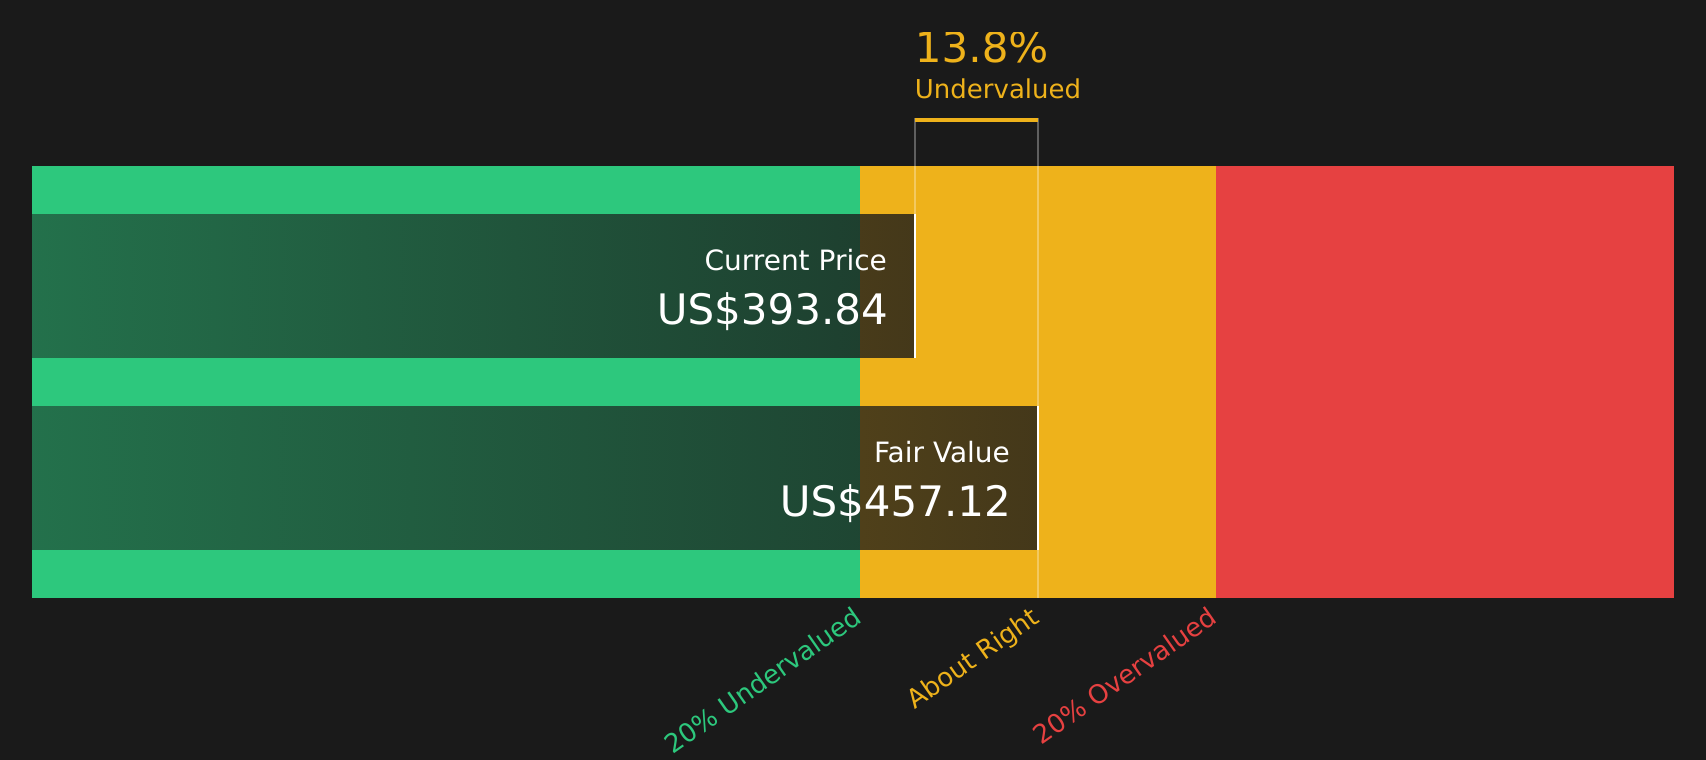
Adding up these discounted cash flows produces an estimated intrinsic value of $457.12 per share under the DCF model. Against a current share price around $393.84, this implies the stock is trading at about a 13.8% discount to that intrinsic value, which suggests the market price is below what this cash flow based model indicates.
Result: UNDERVALUED
Our Discounted Cash Flow (DCF) analysis suggests F5 is undervalued by 13.8%. Track this in your watchlist or portfolio, or discover 46 more high quality undervalued stocks.
Approach 2: F5 Price vs Earnings
For a profitable company like F5, the P/E ratio is a useful cross check on value because it directly links what you pay for the stock to the earnings it generates. In general, higher growth expectations and lower perceived risk can justify a higher P/E, while slower growth and higher risk usually warrant a lower, more conservative P/E.
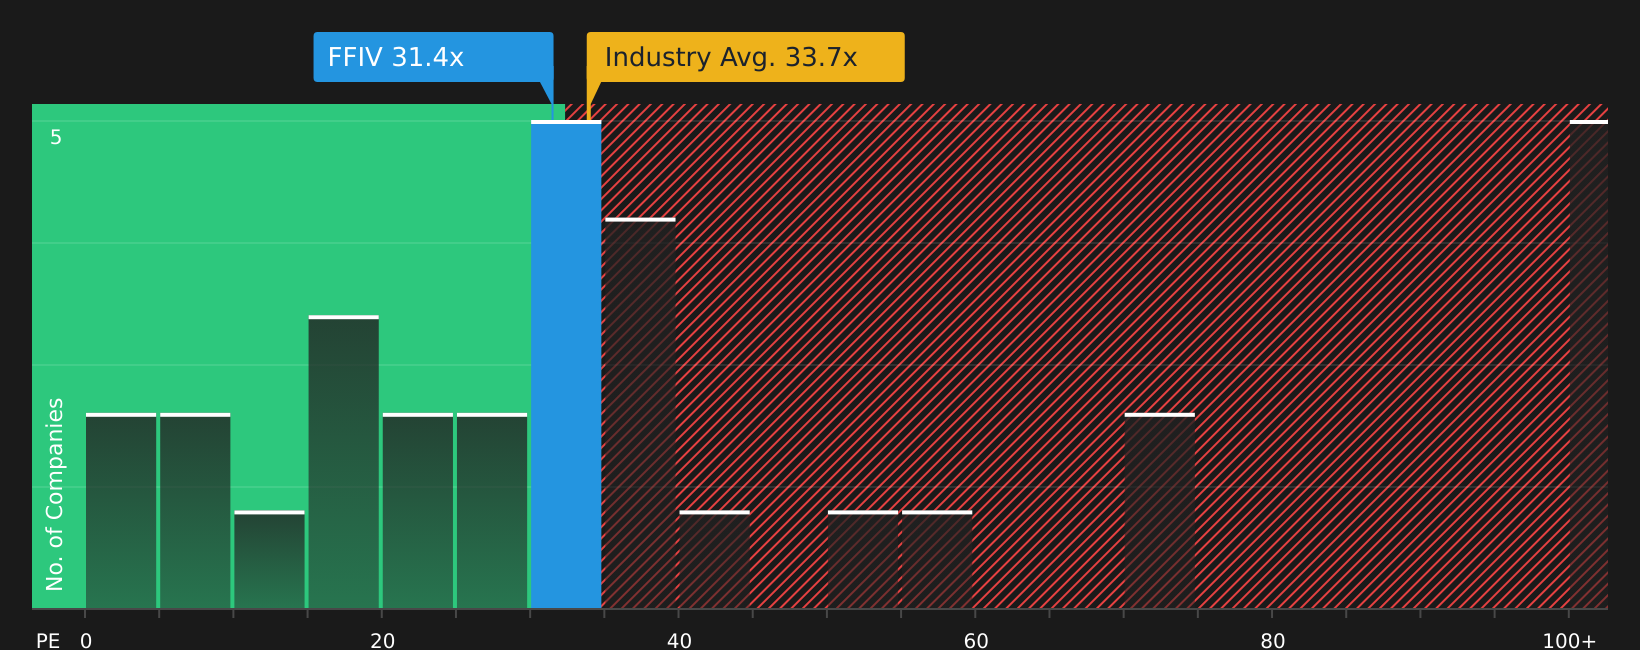
F5 is trading on a P/E of 31.37x. That sits close to the Communications industry average P/E of 32.40x, and well below the peer group average of 92.85x. On its own, that might suggest the stock is priced more cautiously than some peers, while still broadly in line with the wider industry.
Simply Wall St’s Fair Ratio for F5 is 29.13x. This is a proprietary estimate of what a reasonable P/E might be, given factors such as F5’s earnings growth profile, industry, profit margins, market cap and risk characteristics. Because it blends these company specific inputs, the Fair Ratio can be more informative than a simple comparison with peers or the industry average.
Set against the current P/E of 31.37x, the Fair Ratio of 29.13x points to F5 trading somewhat above that tailored benchmark.
Result: OVERVALUED
P/E ratios tell one story, but what if the real opportunity lies elsewhere? Start investing in legacies, not executives. Discover our 20 top founder-led companies.
Upgrade Your Decision Making: Choose your F5 Narrative
Earlier it was mentioned that there is an even better way to understand valuation. Narratives on Simply Wall St’s Community page give you a simple way to attach your story about F5 to the numbers by linking a view of its business, a forecast for revenue, earnings and margins, and a resulting fair value. This allows you to quickly compare that fair value with the current price and see whether your thesis points you toward buying or selling. Those Narratives then update as fresh news or earnings arrive. One investor might build a more optimistic F5 Narrative around higher revenue growth, a fair value near the bullish US$464.25 target and assumptions like earnings reaching US$1.1b. Another might build a more cautious Narrative closer to the bearish US$301.32 view with earnings at US$819.3m and a lower P/E. Yet both are using the same tool to keep their decisions grounded in clear numbers plus a clear story.
For F5 however we will make it really easy for you with previews of two leading F5 Narratives:
Fair value: US$406.50
Implied discount vs last close: about 3.1% below this fair value
Revenue growth used in this narrative: 6.77%
- Highlights enterprise demand for hybrid multicloud and AI focused security, with F5 positioned in application delivery and protection across regions.
- Builds in analyst assumptions for revenue to reach about US$3.9b and earnings of US$904.2m by 2029, with profit margins edging up and a future P/E of 30.8x.
- Flags risks including slower software adoption, hardware tailwinds fading, strong hyperscaler competition and margin pressure if hardware demand normalizes faster than software growth.
Fair value: US$301.32
Implied premium vs last close: about 30.7% above this fair value
Revenue growth used in this narrative: 3.94%
- Frames a slower growth path where hybrid multicloud complexity, vendor consolidation and cloud native alternatives could weigh on product revenue and renewals.
- Uses assumptions for revenue of about US$3.6b and earnings of US$819.3m by 2029, with a future P/E of 25.2x and slightly higher margins than today.
- Points to risks around a peaking hardware refresh cycle, higher component costs and tougher competition in application and API security that could pressure gross and net margins.
If you want to see how other investors are balancing these two stories against the current share price, the community Narratives page lays out the full range of views side by side See what the community is saying about F5.
Do you think there's more to the story for F5? Head over to our Community to see what others are saying!

This article by Simply Wall St is general in nature. We provide commentary based on historical data and analyst forecasts only using an unbiased methodology and our articles are not intended to be financial advice. It does not constitute a recommendation to buy or sell any stock, and does not take account of your objectives, or your financial situation. We aim to bring you long-term focused analysis driven by fundamental data. Note that our analysis may not factor in the latest price-sensitive company announcements or qualitative material. Simply Wall St has no position in any stocks mentioned.
Have feedback on this article? Concerned about the content? Get in touch with us directly. Alternatively, email editorial-team@simplywallst.com
Contact Us
Contact Number :+852 3852 8500Webull Securities Limited is licensed with the Securities and Futures Commission of Hong Kong (CE No. BNG700) for carrying out Type 1 License for Dealing in Securities, Type 2 License for Dealing in Futures Contracts and Type 4 License for Advising on Securities.

English