
Asian Stocks That May Be Trading Up To 48.3% Below Estimated Intrinsic Value
As Asian markets navigate a period of volatility, driven by global technology sell-offs and regional economic shifts, investors are keenly observing opportunities for value investment. In such environments, identifying stocks trading below their intrinsic value can present potential for growth, especially when considering factors like strong fundamentals and resilience amidst broader market fluctuations.
Top 10 Undervalued Stocks Based On Cash Flows In Asia
| Name | Current Price | Fair Value (Est) | Discount (Est) |
| Xianheng International Science&Technology (SHSE:605056) | CN¥15.96 | CN¥31.48 | 49.3% |
| Startia HoldingsInc (TSE:3393) | ¥3000.00 | ¥5858.58 | 48.8% |
| SILICON2 (KOSDAQ:A257720) | ₩35550.00 | ₩68777.87 | 48.3% |
| Moshi Moshi Retail Corporation (SET:MOSHI) | THB38.50 | THB75.31 | 48.9% |
| Medeze Group (SET:MEDEZE) | THB6.35 | THB12.26 | 48.2% |
| Innovent Biologics (SEHK:1801) | HK$79.60 | HK$158.64 | 49.8% |
| Guangdong Huayan Robotics (SEHK:1021) | HK$18.15 | HK$35.96 | 49.5% |
| CanSino Biologics (SEHK:6185) | HK$22.28 | HK$44.34 | 49.8% |
| BEAUTY GARAGE (TSE:3180) | ¥1438.00 | ¥2848.04 | 49.5% |
| Akeso (SEHK:9926) | HK$88.05 | HK$174.99 | 49.7% |
Let's take a closer look at a couple of our picks from the screened companies.
SILICON2 (KOSDAQ:A257720)
Overview: SILICON2 Co., Ltd. is involved in the global distribution of cosmetics products and has a market cap of approximately ₩2.33 billion.
Operations: The company generates revenue from wholesale miscellaneous activities amounting to approximately ₩1.22 billion.
Estimated Discount To Fair Value: 48.3%
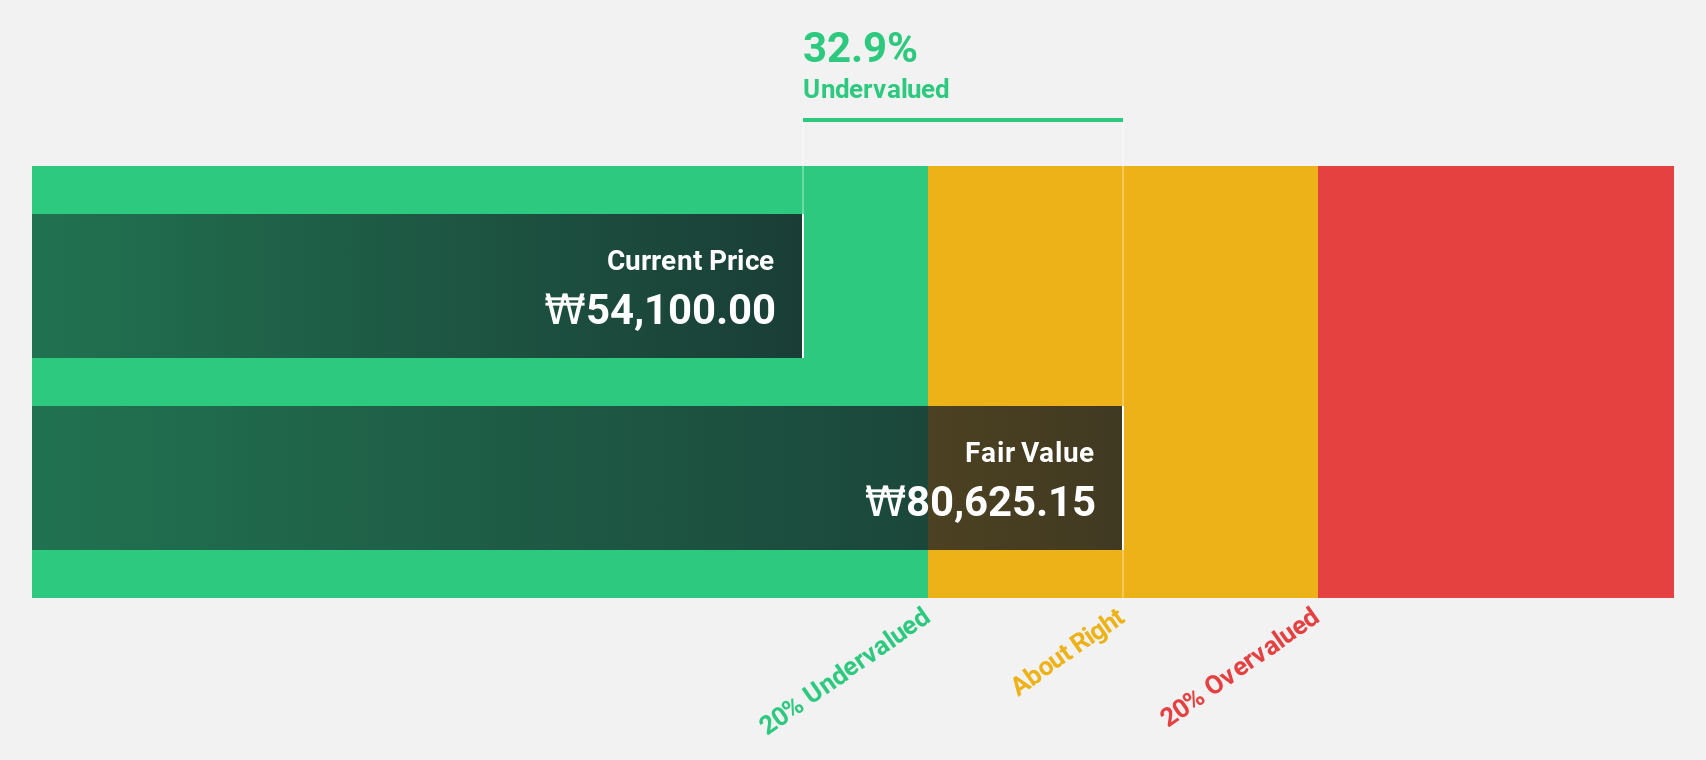
SILICON2 Co., Ltd. appears undervalued based on its cash flows, trading at ₩35,550 compared to an estimated future cash flow value of ₩68,777.87. The stock is 48.3% below fair value estimates and analysts anticipate a 52.7% price rise. Recent earnings show significant growth with net income increasing to KRW 54 billion from KRW 38 billion year-over-year, while revenue is projected to grow at 21.9% annually, outpacing the market average in Korea.
- Insights from our recent growth report point to a promising forecast for SILICON2's business outlook.
- Take a closer look at SILICON2's balance sheet health here in our report.
Xunfei Healthcare Technology (SEHK:2506)
Overview: Xunfei Healthcare Technology Co., Ltd. offers healthcare AI solutions in the People’s Republic of China and has a market cap of approximately HK$10.41 billion.
Operations: The company generates revenue through several segments, including Primary Solutions (CN¥262.86 million), Hospital Solutions (CN¥173.14 million), Regional Solutions (CN¥205.93 million), and Patient Management Services (CN¥273.06 million).
Estimated Discount To Fair Value: 12.8%
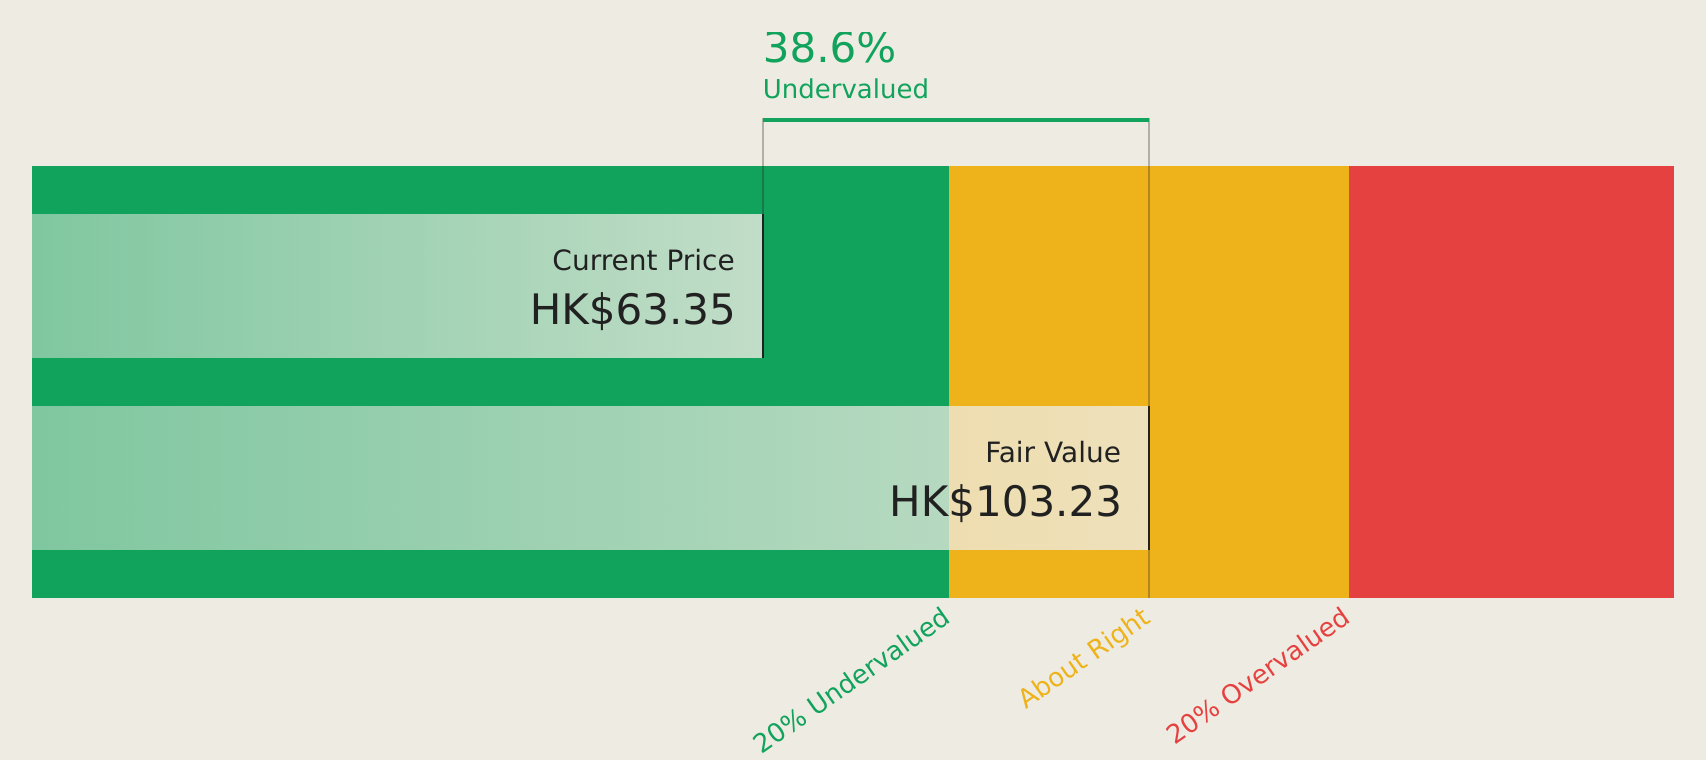
Xunfei Healthcare Technology trades at HK$86.15, below its estimated future cash flow value of HK$98.79, indicating it is undervalued by 12.8%. The company is expected to become profitable in the next three years with revenue projected to grow at 23.6% annually, surpassing market averages in Hong Kong. However, its return on equity remains low and it has less than a year of cash runway, highlighting potential financial constraints despite strategic expansion into Indonesia's digital health sector.
- Our comprehensive growth report raises the possibility that Xunfei Healthcare Technology is poised for substantial financial growth.
- Navigate through the intricacies of Xunfei Healthcare Technology with our comprehensive financial health report here.
Huatu Cendes (SZSE:300492)
Overview: Huatu Cendes Co., Ltd. is an architectural design company offering professional design, consulting, and engineering services to various enterprises and government agencies in China, with a market cap of CN¥7.44 billion.
Operations: Huatu Cendes generates revenue through providing architectural design, consulting, and engineering services to a diverse clientele including state-owned enterprises, private companies, multinational corporations, and government agencies across China.
Estimated Discount To Fair Value: 41.5%
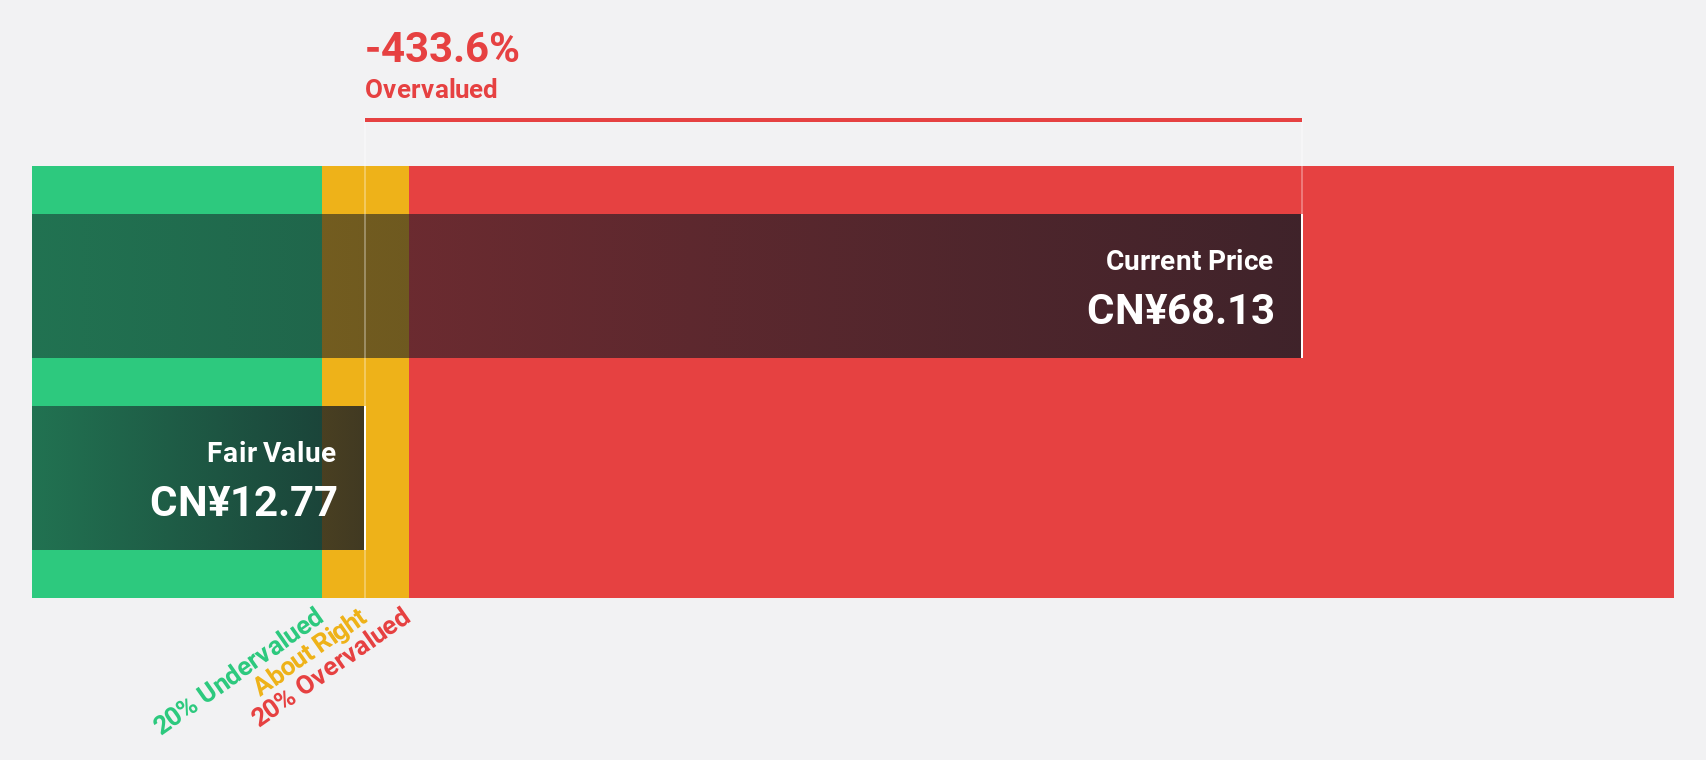
Huatu Cendes, trading at CNY 37.85, is significantly undervalued compared to its estimated future cash flow value of CNY 64.65, with a potential upside of over 40%. The company's earnings grew by a very large margin last year and are forecasted to increase by 42.6% annually, outpacing the Chinese market's growth rate. Despite recent dividend increases, its unstable dividend history may concern income-focused investors.
- Our growth report here indicates Huatu Cendes may be poised for an improving outlook.
- Click here to discover the nuances of Huatu Cendes with our detailed financial health report.
Taking Advantage
- Click through to start exploring the rest of the 165 Undervalued Asian Stocks Based On Cash Flows now.
- Hold shares in these firms? Setup your portfolio in Simply Wall St to seamlessly track your investments and receive personalized updates on your portfolio's performance.
- Streamline your investment strategy with Simply Wall St's app for free and benefit from extensive research on stocks across all corners of the world.
Curious About Other Options?
- Explore high-performing small cap companies that haven't yet garnered significant analyst attention.
- Diversify your portfolio with solid dividend payers offering reliable income streams to weather potential market turbulence.
- Fuel your portfolio with companies showing strong growth potential, backed by optimistic outlooks both from analysts and management.
This article by Simply Wall St is general in nature. We provide commentary based on historical data and analyst forecasts only using an unbiased methodology and our articles are not intended to be financial advice. It does not constitute a recommendation to buy or sell any stock, and does not take account of your objectives, or your financial situation. We aim to bring you long-term focused analysis driven by fundamental data. Note that our analysis may not factor in the latest price-sensitive company announcements or qualitative material. Simply Wall St has no position in any stocks mentioned.
Have feedback on this article? Concerned about the content? Get in touch with us directly. Alternatively, email editorial-team@simplywallst.com
Contact Us
Contact Number :+852 3852 8500Webull Securities Limited is licensed with the Securities and Futures Commission of Hong Kong (CE No. BNG700) for carrying out Type 1 License for Dealing in Securities, Type 2 License for Dealing in Futures Contracts and Type 4 License for Advising on Securities.

English