Ko Yo Chemical (Group) Limited (HKG:827) shares have had a horrible month, losing 26% after a relatively good period beforehand. The recent drop completes a disastrous twelve months for shareholders, who are sitting on a 55% loss during that time.
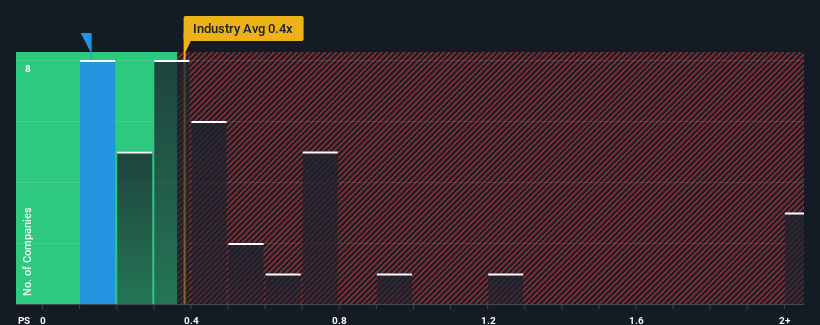
In spite of the heavy fall in price, there still wouldn't be many who think Ko Yo Chemical (Group)'s price-to-sales (or "P/S") ratio of 0.1x is worth a mention when the median P/S in Hong Kong's Chemicals industry is similar at about 0.4x. Although, it's not wise to simply ignore the P/S without explanation as investors may be disregarding a distinct opportunity or a costly mistake.
View our latest analysis for Ko Yo Chemical (Group)
How Has Ko Yo Chemical (Group) Performed Recently?
For example, consider that Ko Yo Chemical (Group)'s financial performance has been poor lately as its revenue has been in decline. It might be that many expect the company to put the disappointing revenue performance behind them over the coming period, which has kept the P/S from falling. If you like the company, you'd at least be hoping this is the case so that you could potentially pick up some stock while it's not quite in favour.
Want the full picture on earnings, revenue and cash flow for the company? Then our free report on Ko Yo Chemical (Group) will help you shine a light on its historical performance.What Are Revenue Growth Metrics Telling Us About The P/S?
Ko Yo Chemical (Group)'s P/S ratio would be typical for a company that's only expected to deliver moderate growth, and importantly, perform in line with the industry.
Taking a look back first, the company's revenue growth last year wasn't something to get excited about as it posted a disappointing decline of 9.4%. Still, the latest three year period has seen an excellent 38% overall rise in revenue, in spite of its unsatisfying short-term performance. Accordingly, while they would have preferred to keep the run going, shareholders would definitely welcome the medium-term rates of revenue growth.
Comparing that to the industry, which is predicted to deliver 11% growth in the next 12 months, the company's momentum is pretty similar based on recent medium-term annualised revenue results.
With this information, we can see why Ko Yo Chemical (Group) is trading at a fairly similar P/S to the industry. Apparently shareholders are comfortable to simply hold on assuming the company will continue keeping a low profile.
The Final Word
Ko Yo Chemical (Group)'s plummeting stock price has brought its P/S back to a similar region as the rest of the industry. Using the price-to-sales ratio alone to determine if you should sell your stock isn't sensible, however it can be a practical guide to the company's future prospects.
It appears to us that Ko Yo Chemical (Group) maintains its moderate P/S off the back of its recent three-year growth being in line with the wider industry forecast. Currently, with a past revenue trend that aligns closely wit the industry outlook, shareholders are confident the company's future revenue outlook won't contain any major surprises. Unless the recent medium-term conditions change, they will continue to support the share price at these levels.
It is also worth noting that we have found 2 warning signs for Ko Yo Chemical (Group) that you need to take into consideration.
Of course, profitable companies with a history of great earnings growth are generally safer bets. So you may wish to see this free collection of other companies that have reasonable P/E ratios and have grown earnings strongly.
Have feedback on this article? Concerned about the content? Get in touch with us directly. Alternatively, email editorial-team (at) simplywallst.com.
This article by Simply Wall St is general in nature. We provide commentary based on historical data and analyst forecasts only using an unbiased methodology and our articles are not intended to be financial advice. It does not constitute a recommendation to buy or sell any stock, and does not take account of your objectives, or your financial situation. We aim to bring you long-term focused analysis driven by fundamental data. Note that our analysis may not factor in the latest price-sensitive company announcements or qualitative material. Simply Wall St has no position in any stocks mentioned.
② More than 40M Downloads Globally : data based on Webull Technologies Limited's internal statistics as of July 14, 2023.
③ Pre-market (4:00 AM - 9:30 AM ET) , after-hours (4:00 PM - 8:00 PM ET) .
Webull Securities Limited is licensed with the Securities and Futures Commission of Hong Kong (CE No. BNG700) for carrying out Type 1 License for Dealing in Securities, Type 2 License for Dealing in Futures Contracts and Type 4 License for Advising on Securities.

English