Some Confidence Is Lacking In Redco Properties Group Limited (HKG:1622) As Shares Slide 55%
Redco Properties Group Limited (HKG:1622) shareholders won't be pleased to see that the share price has had a very rough month, dropping 55% and undoing the prior period's positive performance. To make matters worse, the recent drop has wiped out a year's worth of gains with the share price now back where it started a year ago.
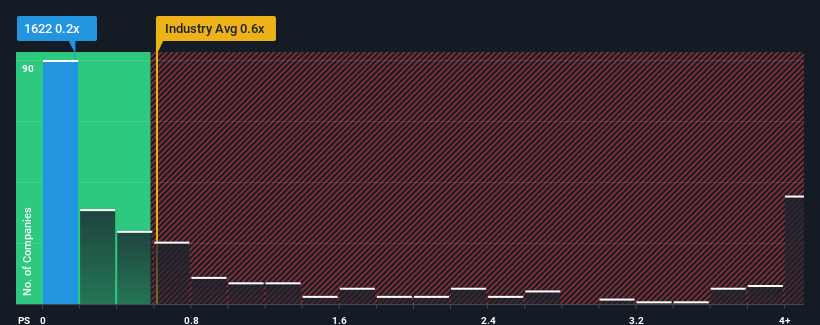
Even after such a large drop in price, there still wouldn't be many who think Redco Properties Group's price-to-sales (or "P/S") ratio of 0.2x is worth a mention when the median P/S in Hong Kong's Real Estate industry is similar at about 0.6x. However, investors might be overlooking a clear opportunity or potential setback if there is no rational basis for the P/S.
View our latest analysis for Redco Properties Group
What Does Redco Properties Group's Recent Performance Look Like?
As an illustration, revenue has deteriorated at Redco Properties Group over the last year, which is not ideal at all. One possibility is that the P/S is moderate because investors think the company might still do enough to be in line with the broader industry in the near future. If not, then existing shareholders may be a little nervous about the viability of the share price.
Although there are no analyst estimates available for Redco Properties Group, take a look at this free data-rich visualisation to see how the company stacks up on earnings, revenue and cash flow.What Are Revenue Growth Metrics Telling Us About The P/S?
There's an inherent assumption that a company should be matching the industry for P/S ratios like Redco Properties Group's to be considered reasonable.
Taking a look back first, the company's revenue growth last year wasn't something to get excited about as it posted a disappointing decline of 55%. The last three years don't look nice either as the company has shrunk revenue by 63% in aggregate. Therefore, it's fair to say the revenue growth recently has been undesirable for the company.
In contrast to the company, the rest of the industry is expected to grow by 5.8% over the next year, which really puts the company's recent medium-term revenue decline into perspective.
With this information, we find it concerning that Redco Properties Group is trading at a fairly similar P/S compared to the industry. It seems most investors are ignoring the recent poor growth rate and are hoping for a turnaround in the company's business prospects. Only the boldest would assume these prices are sustainable as a continuation of recent revenue trends is likely to weigh on the share price eventually.
What Does Redco Properties Group's P/S Mean For Investors?
Following Redco Properties Group's share price tumble, its P/S is just clinging on to the industry median P/S. Typically, we'd caution against reading too much into price-to-sales ratios when settling on investment decisions, though it can reveal plenty about what other market participants think about the company.
We find it unexpected that Redco Properties Group trades at a P/S ratio that is comparable to the rest of the industry, despite experiencing declining revenues during the medium-term, while the industry as a whole is expected to grow. Even though it matches the industry, we're uncomfortable with the current P/S ratio, as this dismal revenue performance is unlikely to support a more positive sentiment for long. Unless the recent medium-term conditions improve markedly, investors will have a hard time accepting the share price as fair value.
Having said that, be aware Redco Properties Group is showing 3 warning signs in our investment analysis, you should know about.
It's important to make sure you look for a great company, not just the first idea you come across. So if growing profitability aligns with your idea of a great company, take a peek at this free list of interesting companies with strong recent earnings growth (and a low P/E).
Have feedback on this article? Concerned about the content? Get in touch with us directly. Alternatively, email editorial-team (at) simplywallst.com.
This article by Simply Wall St is general in nature. We provide commentary based on historical data and analyst forecasts only using an unbiased methodology and our articles are not intended to be financial advice. It does not constitute a recommendation to buy or sell any stock, and does not take account of your objectives, or your financial situation. We aim to bring you long-term focused analysis driven by fundamental data. Note that our analysis may not factor in the latest price-sensitive company announcements or qualitative material. Simply Wall St has no position in any stocks mentioned.
① During the campaign period, US stocks, US stocks short selling, US stock options, Hong Kong stocks, and A-shares trading will maintain at $0 commission, and no subscription/redemption fees for mutual fund transactions. $0 fee offer has a time limit, until further notice. For more information, please visit: https://www.webull.hk/pricing
Webull Securities Limited is licensed with the Securities and Futures Commission of Hong Kong (CE No. BNG700) for carrying out Type 1 License for Dealing in Securities, Type 2 License for Dealing in Futures Contracts and Type 4 License for Advising on Securities.

English