Revenues Tell The Story For Crosstec Group Holdings Limited (HKG:3893) As Its Stock Soars 26%
Crosstec Group Holdings Limited (HKG:3893) shareholders are no doubt pleased to see that the share price has bounced 26% in the last month, although it is still struggling to make up recently lost ground. But the gains over the last month weren't enough to make shareholders whole, as the share price is still down 4.9% in the last twelve months.
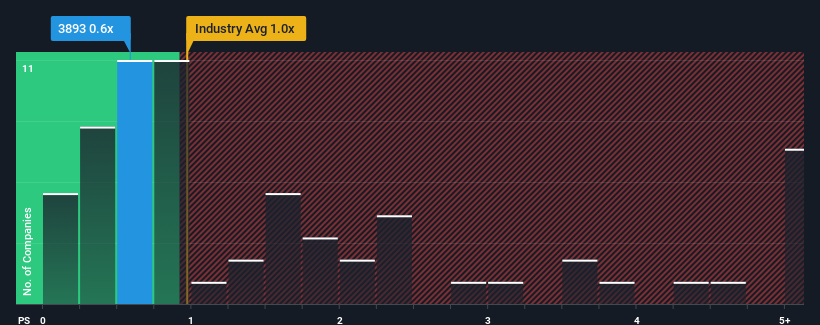
In spite of the firm bounce in price, there still wouldn't be many who think Crosstec Group Holdings' price-to-sales (or "P/S") ratio of 0.6x is worth a mention when the median P/S in Hong Kong's Consumer Services industry is similar at about 1x. While this might not raise any eyebrows, if the P/S ratio is not justified investors could be missing out on a potential opportunity or ignoring looming disappointment.
View our latest analysis for Crosstec Group Holdings
What Does Crosstec Group Holdings' Recent Performance Look Like?
Crosstec Group Holdings certainly has been doing a great job lately as it's been growing its revenue at a really rapid pace. The P/S is probably moderate because investors think this strong revenue growth might not be enough to outperform the broader industry in the near future. Those who are bullish on Crosstec Group Holdings will be hoping that this isn't the case, so that they can pick up the stock at a lower valuation.
Want the full picture on earnings, revenue and cash flow for the company? Then our free report on Crosstec Group Holdings will help you shine a light on its historical performance.Do Revenue Forecasts Match The P/S Ratio?
There's an inherent assumption that a company should be matching the industry for P/S ratios like Crosstec Group Holdings' to be considered reasonable.
Retrospectively, the last year delivered an exceptional 151% gain to the company's top line. Pleasingly, revenue has also lifted 64% in aggregate from three years ago, thanks to the last 12 months of growth. So we can start by confirming that the company has done a great job of growing revenue over that time.
It's interesting to note that the rest of the industry is similarly expected to grow by 19% over the next year, which is fairly even with the company's recent medium-term annualised growth rates.
With this information, we can see why Crosstec Group Holdings is trading at a fairly similar P/S to the industry. It seems most investors are expecting to see average growth rates continue into the future and are only willing to pay a moderate amount for the stock.
The Final Word
Its shares have lifted substantially and now Crosstec Group Holdings' P/S is back within range of the industry median. We'd say the price-to-sales ratio's power isn't primarily as a valuation instrument but rather to gauge current investor sentiment and future expectations.
As we've seen, Crosstec Group Holdings' three-year revenue trends seem to be contributing to its P/S, given they look similar to current industry expectations. With previous revenue trends that keep up with the current industry outlook, it's hard to justify the company's P/S ratio deviating much from it's current point. If recent medium-term revenue trends continue, it's hard to see the share price moving strongly in either direction in the near future under these circumstances.
Before you take the next step, you should know about the 5 warning signs for Crosstec Group Holdings (4 are a bit unpleasant!) that we have uncovered.
Of course, profitable companies with a history of great earnings growth are generally safer bets. So you may wish to see this free collection of other companies that have reasonable P/E ratios and have grown earnings strongly.
Have feedback on this article? Concerned about the content? Get in touch with us directly. Alternatively, email editorial-team (at) simplywallst.com.
This article by Simply Wall St is general in nature. We provide commentary based on historical data and analyst forecasts only using an unbiased methodology and our articles are not intended to be financial advice. It does not constitute a recommendation to buy or sell any stock, and does not take account of your objectives, or your financial situation. We aim to bring you long-term focused analysis driven by fundamental data. Note that our analysis may not factor in the latest price-sensitive company announcements or qualitative material. Simply Wall St has no position in any stocks mentioned.
① During the campaign period, US stocks, US stocks short selling, US stock options, Hong Kong stocks, and A-shares trading will maintain at $0 commission, and no subscription/redemption fees for mutual fund transactions. $0 fee offer has a time limit, until further notice. For more information, please visit: https://www.webull.hk/pricing
Webull Securities Limited is licensed with the Securities and Futures Commission of Hong Kong (CE No. BNG700) for carrying out Type 1 License for Dealing in Securities, Type 2 License for Dealing in Futures Contracts and Type 4 License for Advising on Securities.

English